ELK部署2
一. 在ELK6上部署nginx+filebeat
0. 修改服务器名称并写入hosts文件,安装时间同步插件
时间同步插件略,可以参考K8s部署
hostnamectl set-hostname ELK6
cat << EOF | tee -a /etc/hosts
192.168.100.102 ELK4
192.168.100.105 ELK6
192.168.100.106 ELK7
EOF
1. 安装nginx
为了方便,我们直接安装rpm包nginx
2. 安装filebeat
这里我们使用二进制包的filebeat
1) 解压软件包
tar xf filebeat-8.15.3-linux-x86_64.tar.gz -C /usr/local/
mv /usr/local/filebeat-8.15.3-linux-x86_64/ /usr/local/filebeat/
2) 修改配置文件
filebeat.yml配置主要有两部分,一个是日志收集,一个是日志输出
需要改的行有:
- type: filestream
# 读取日志的每一行(默认)
  enabled: false
  # 该配置是否生效,如果为false,将不再收集该配置的日志
  paths:
  # 要抓取日志的绝对路径
    - /var/log/*.log
    # 添加收集httpd服务日志
output.elasticsearch:
  hosts: ["localhost:9200"]
  preset: balanced
# 这三行注释掉
#output.logstash:
# 取消注释,把日志放到logstash中
  #hosts: ["localhost:5044"]
  # 取消注释,输出到Logstash的地址和端口
logging.level: warning
# 新增这一行,调整日志级别
我们可以使用sed命令一次性修改(方法1)
sed -i -e 's@- type: filestream@- type: log@' \
  -e 's@enabled: false@enabled: true@' \
  -e 's@- /var/log/\*\.log@- /var/log/nginx/\*\.log@' \
  -e 's@#output.elasticsearch:@output.elasticsearch:@' \
  -e 's@hosts: \["localhost:9200"\]@hosts: ["192.168.100.102:9200"]@' \
  -e 's@preset: balanced@#preset: balanced@' \
  -e '167a logging.level: warning' \
/usr/local/filebeat/filebeat.yml
或者直接粘贴下面这一段(方法2)
filebeat.inputs:
- type: log
  id: my-filestream-id
  enabled: true
  paths:
    - /var/log/nginx/*.log
filebeat.config.modules:
  path: ${path.config}/modules.d/*.yml
  reload.enabled: true
setup.template.settings:
  index.number_of_shards: 1
setup.kibana:
logging.level: warning
processors:
  - add_host_metadata:
      when.not.contains.tags: forwarded
  - add_cloud_metadata: ~
  - add_docker_metadata: ~
  - add_kubernetes_metadata: ~
3) 启动服务
可以另开一个终端查看服务
[root@ELK6 ~]# ps -ef|grep filebeat
root        1441    1337  1 09:24 pts/0    00:00:00 ./filebeat -e -c filebeat.yml
root        1479    1452  0 09:25 pts/1    00:00:00 grep --color=auto filebeat
注
二. 回到ELK4上修改配置
1. 配置http_logstash.conf配置文件
cat << 'EOF' | tee  /etc/logstash/conf.d/http_logstash.conf
input {
    beats {
    #从Elasticbeats接收事件
        codec => plain {charset => "UTF-8" }
        # 设置编解码器为UTF8
        port => "5044"
    }
}
output {
    stdout {
    # 标准输出,把手机的日志在当前终端显示,方便测试服务连通性
        codec => "rubydebug"
        # 指定编码器
    }
    elasticsearch {
    # 把收集的日志发送给es
        hosts => ["192.168.100.102:9200"]
        # es服务器的地址
        index => "nginx-logs-%{+yyyy.MM.dd}"
        # 创建索引
    }
}
EOF
2. 语法检测,无误后重启服务
[root@ELK4 ~]# /usr/share/logstash/bin/logstash -t --path.settings /etc/logstash && systemctl restart logstash
Using bundled JDK: /usr/share/logstash/jdk
Sending Logstash logs to /var/log/logstash which is now configured via log4j2.properties
[2026-08-06T10:03:15,777][WARN ][logstash.runner          ] NOTICE: Running Logstash as a superuser is strongly discouraged as it poses a security risk. Set 'allow_superuser' to false for better security.
[2026-08-06T10:03:15,788][INFO ][logstash.runner          ] Log4j configuration path used is: /etc/logstash/log4j2.properties
[2026-08-06T10:03:15,790][INFO ][logstash.runner          ] Starting Logstash {"logstash.version"=>"8.19.19", "jruby.version"=>"jruby 9.4.15.0 (3.1.7) 2026-06-08 6114208a31 OpenJDK 64-Bit Server VM 21.0.11+10-LTS on 21.0.11+10-LTS +indy +jit [x86_64-linux]"}
[2026-08-06T10:03:15,792][INFO ][logstash.runner          ] JVM bootstrap flags: [-Xms512m, -Xmx512m, -Djava.awt.headless=true, -Dfile.encoding=UTF-8, -Djruby.compile.invokedynamic=true, -XX:+HeapDumpOnOutOfMemoryError, -Djava.security.egd=file:/dev/urandom, -Dlog4j2.isThreadContextMapInheritable=true, -Djruby.regexp.interruptible=true, -Djdk.io.File.enableADS=true, --add-exports=jdk.compiler/com.sun.tools.javac.api=ALL-UNNAMED, --add-exports=jdk.compiler/com.sun.tools.javac.file=ALL-UNNAMED, --add-exports=jdk.compiler/com.sun.tools.javac.parser=ALL-UNNAMED, --add-exports=jdk.compiler/com.sun.tools.javac.tree=ALL-UNNAMED, --add-exports=jdk.compiler/com.sun.tools.javac.util=ALL-UNNAMED, --add-opens=java.base/java.security=ALL-UNNAMED, --add-opens=java.base/java.io=ALL-UNNAMED, --add-opens=java.base/java.nio.channels=ALL-UNNAMED, --add-opens=java.base/sun.nio.ch=ALL-UNNAMED, --add-opens=java.management/sun.management=ALL-UNNAMED, -Dio.netty.allocator.maxOrder=11]
[2026-08-06T10:03:15,844][INFO ][org.logstash.jackson.StreamReadConstraintsUtil] Jackson default value override `logstash.jackson.stream-read-constraints.max-string-length` configured to `200000000` (logstash default)
[2026-08-06T10:03:15,844][INFO ][org.logstash.jackson.StreamReadConstraintsUtil] Jackson default value override `logstash.jackson.stream-read-constraints.max-number-length` configured to `10000` (logstash default)
[2026-08-06T10:03:15,845][INFO ][org.logstash.jackson.StreamReadConstraintsUtil] Jackson default value override `logstash.jackson.stream-read-constraints.max-nesting-depth` configured to `1000` (logstash default)
[2026-08-06T10:03:16,655][INFO ][org.reflections.Reflections] Reflections took 126 ms to scan 1 urls, producing 150 keys and 530 values
[2026-08-06T10:03:17,234][INFO ][logstash.javapipeline    ] Pipeline `main` is configured with `pipeline.ecs_compatibility: v8` setting. All plugins in this pipeline will default to `ecs_compatibility => v8` unless explicitly configured otherwise.
Configuration OK
[2026-08-06T10:03:17,237][INFO ][logstash.runner          ] Using config.test_and_exit mode. Config Validation Result: OK. Exiting Logstash
检查端口占用情况
3. 配置kibana
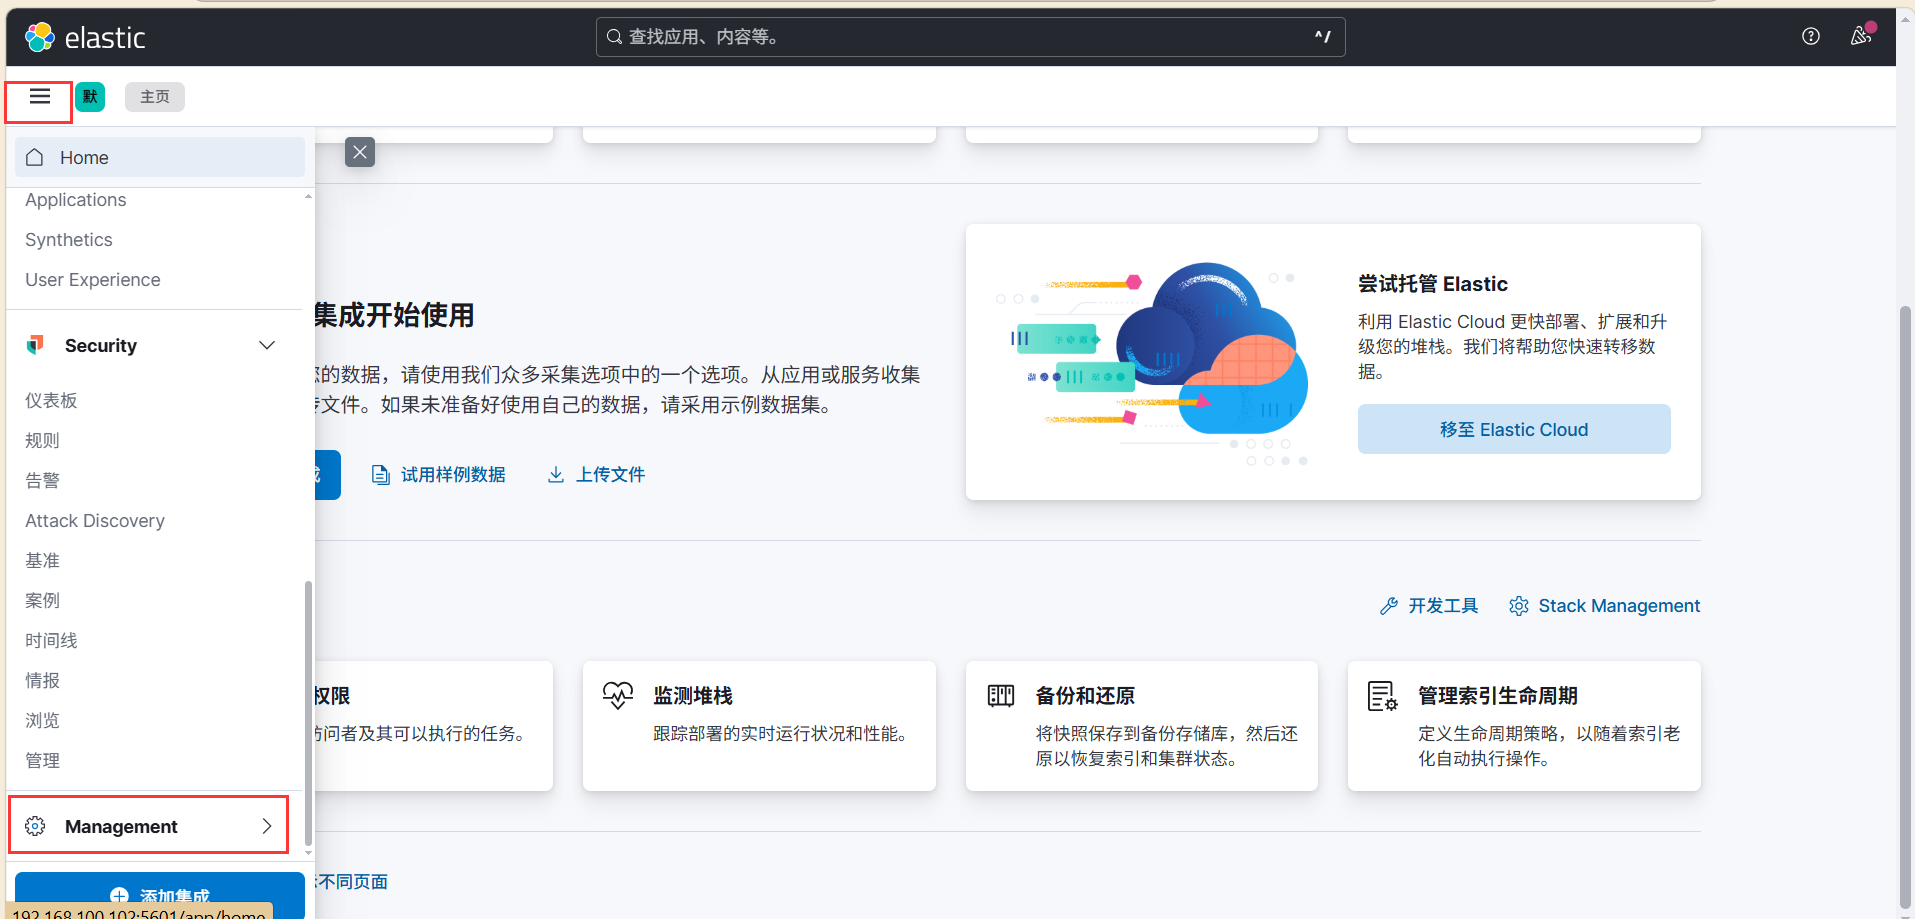
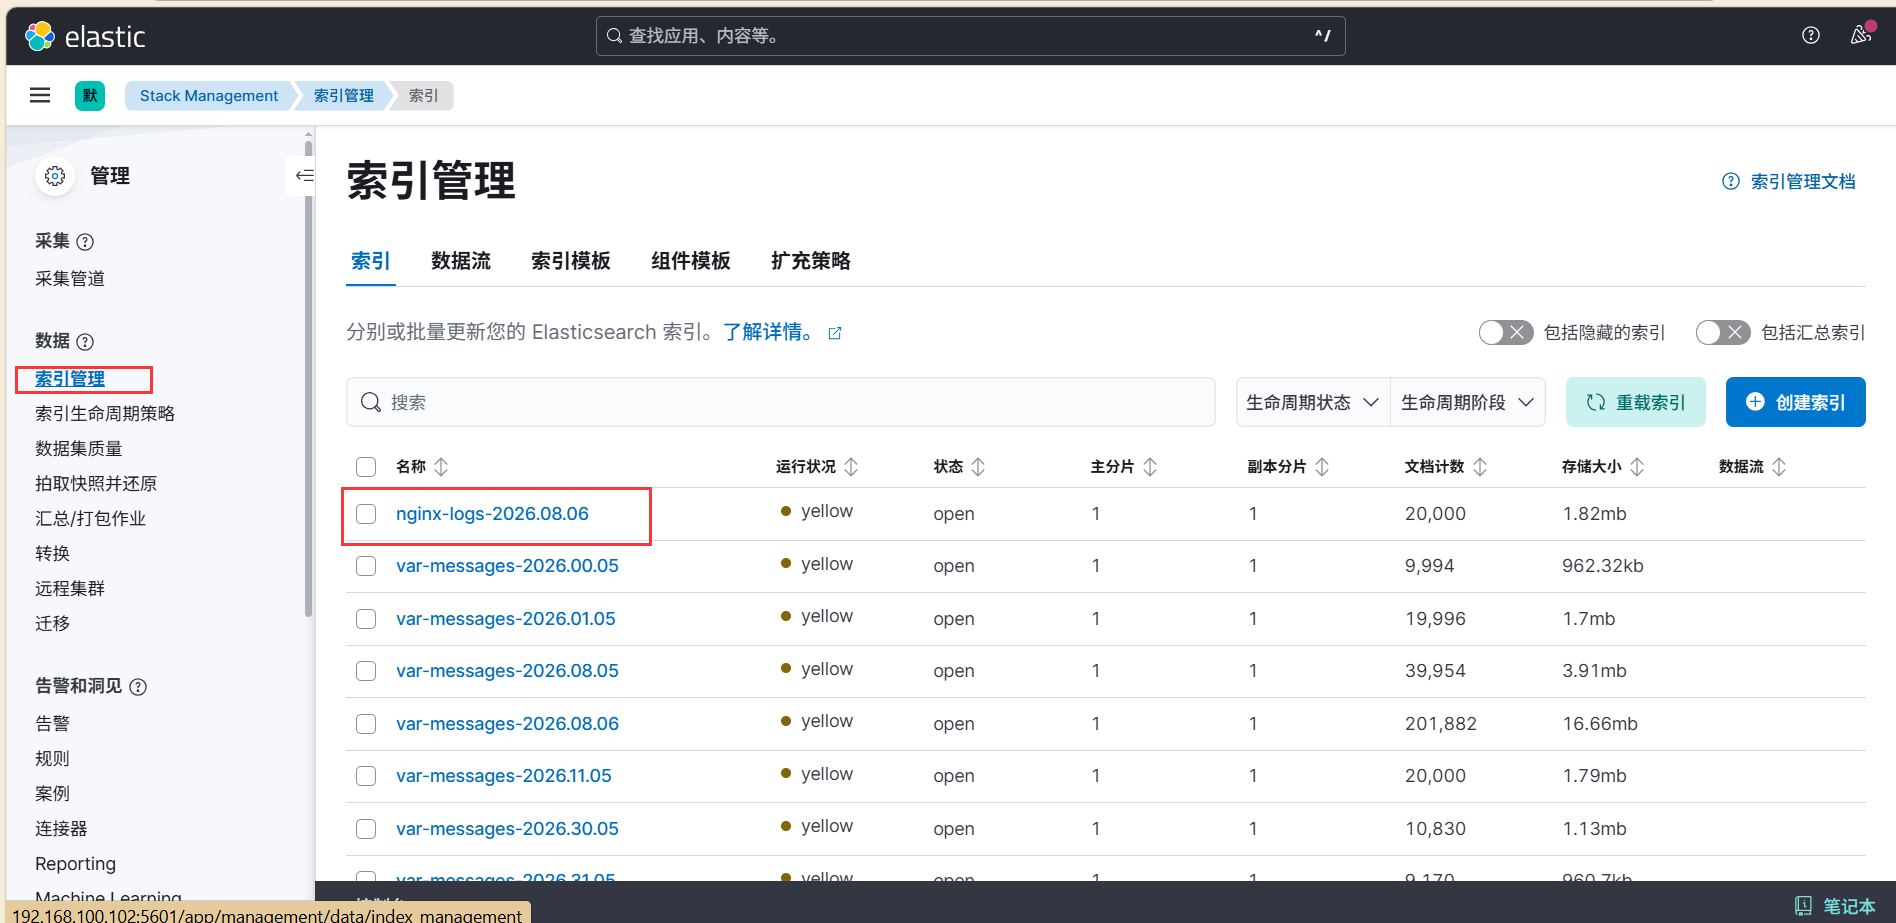
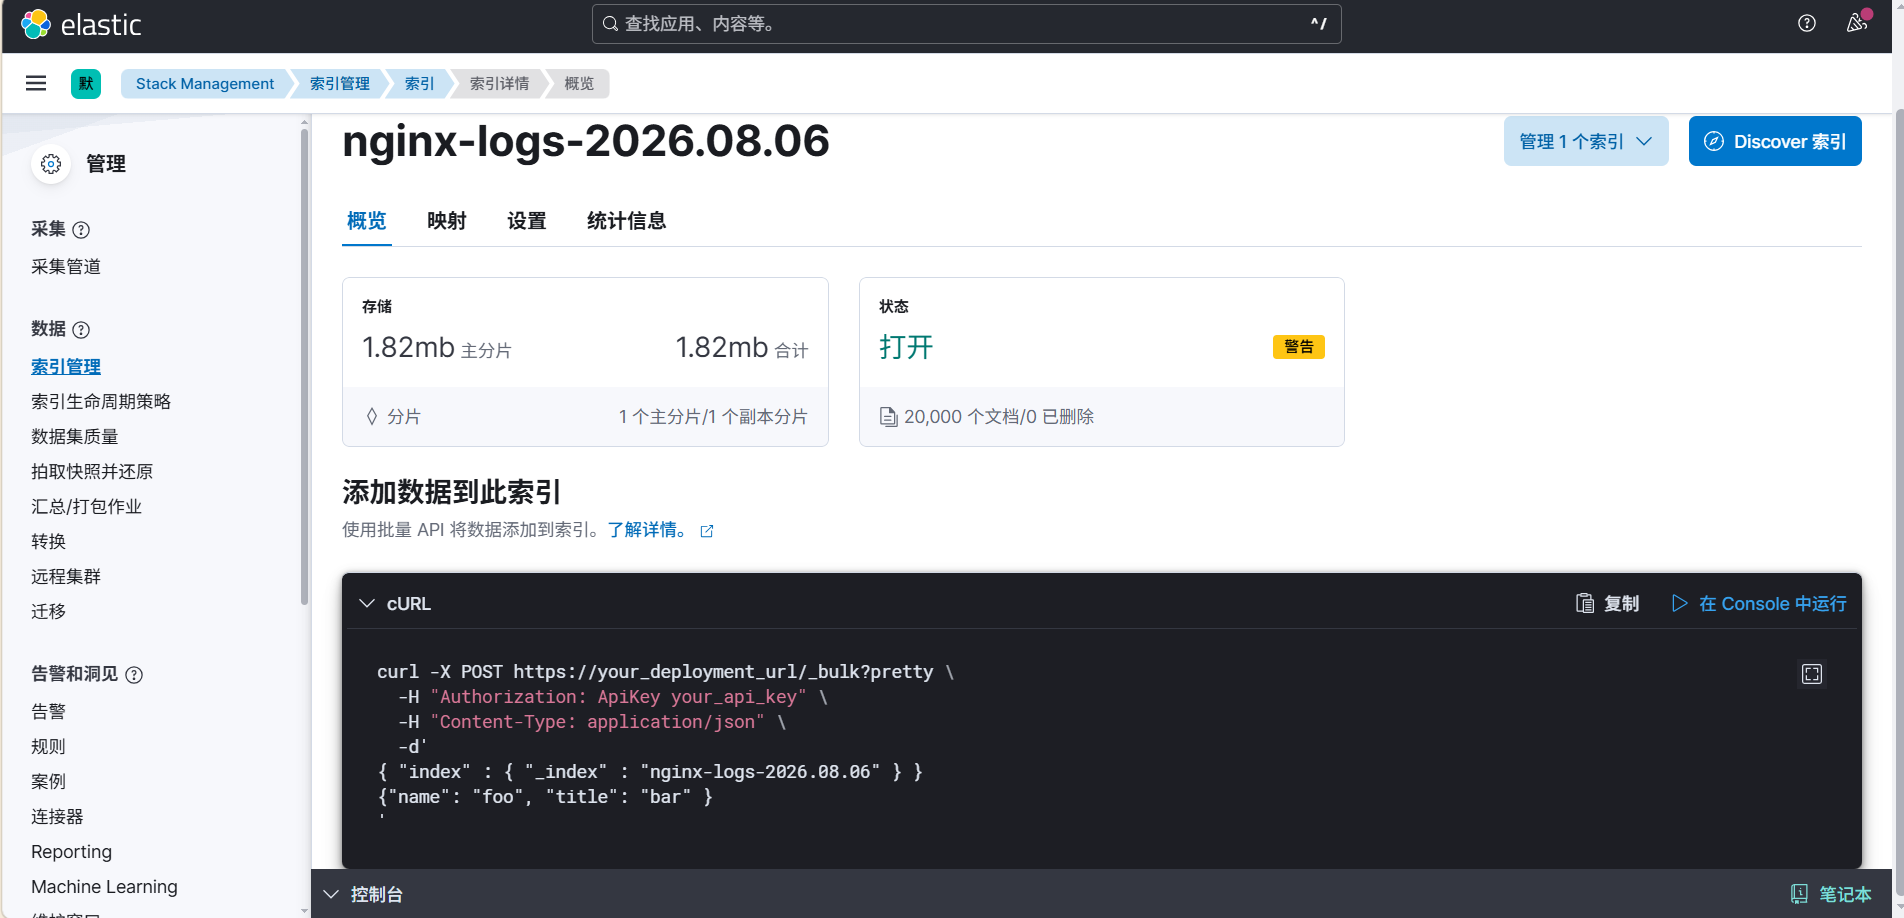
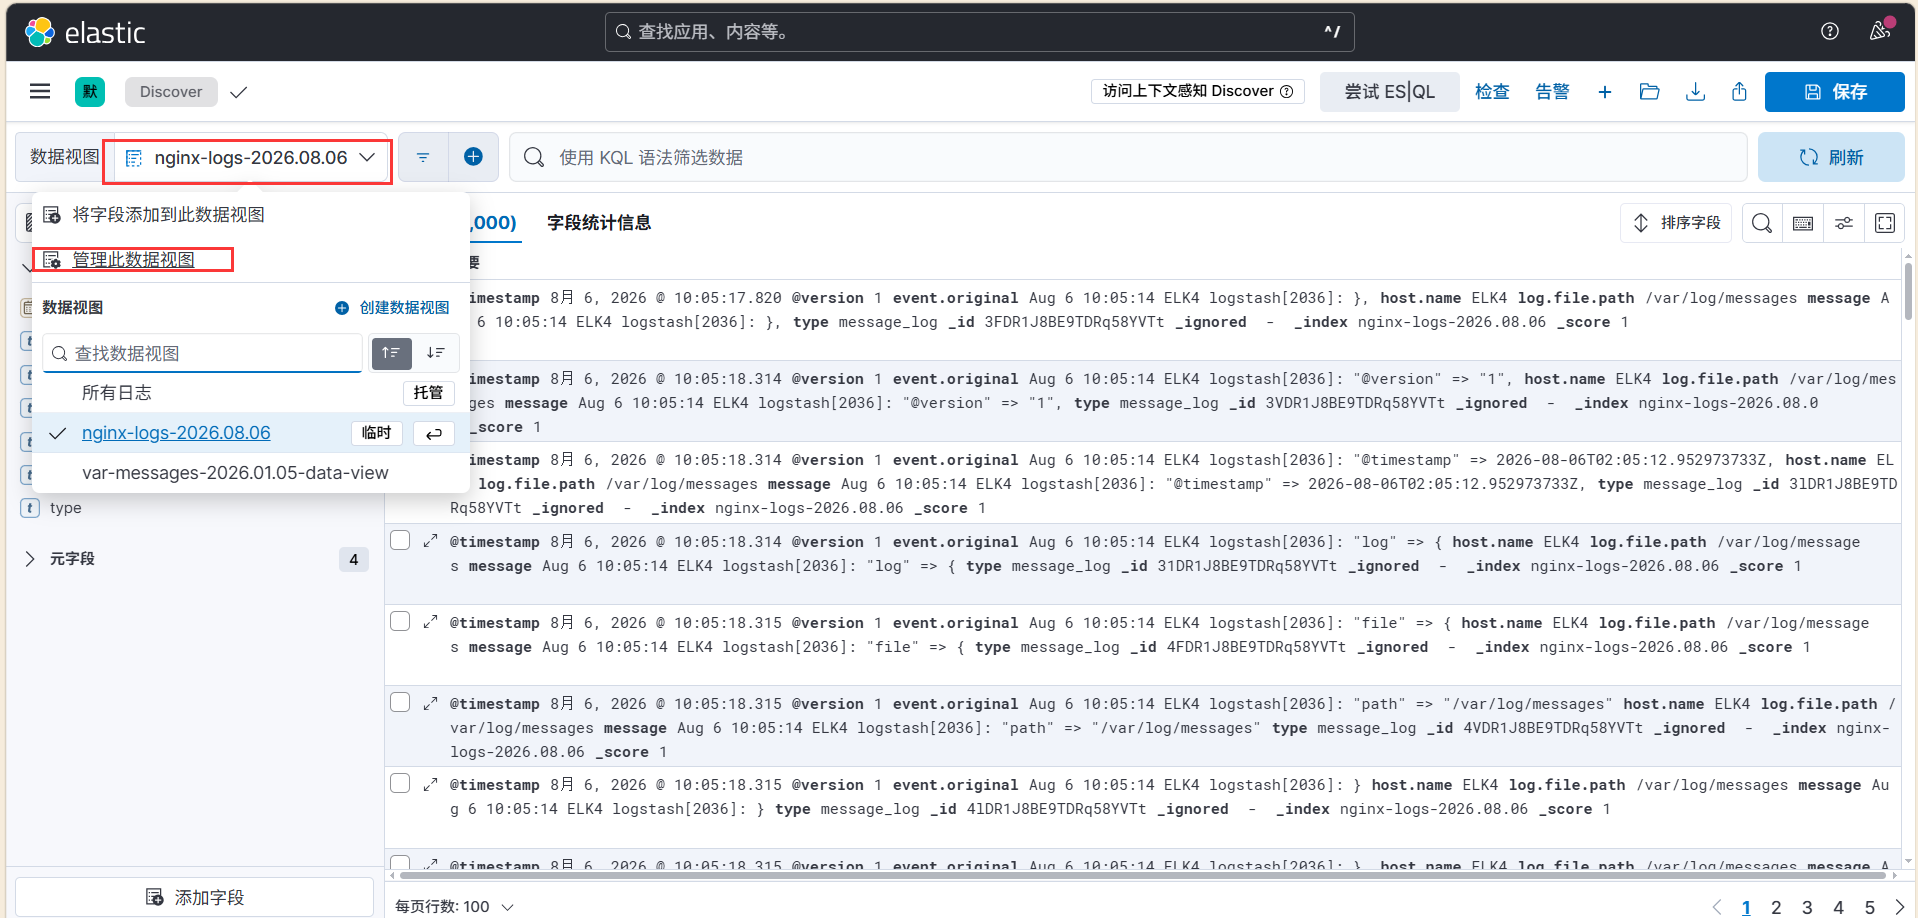
1) 查看index
elastic: http://192.168.100.102:5601
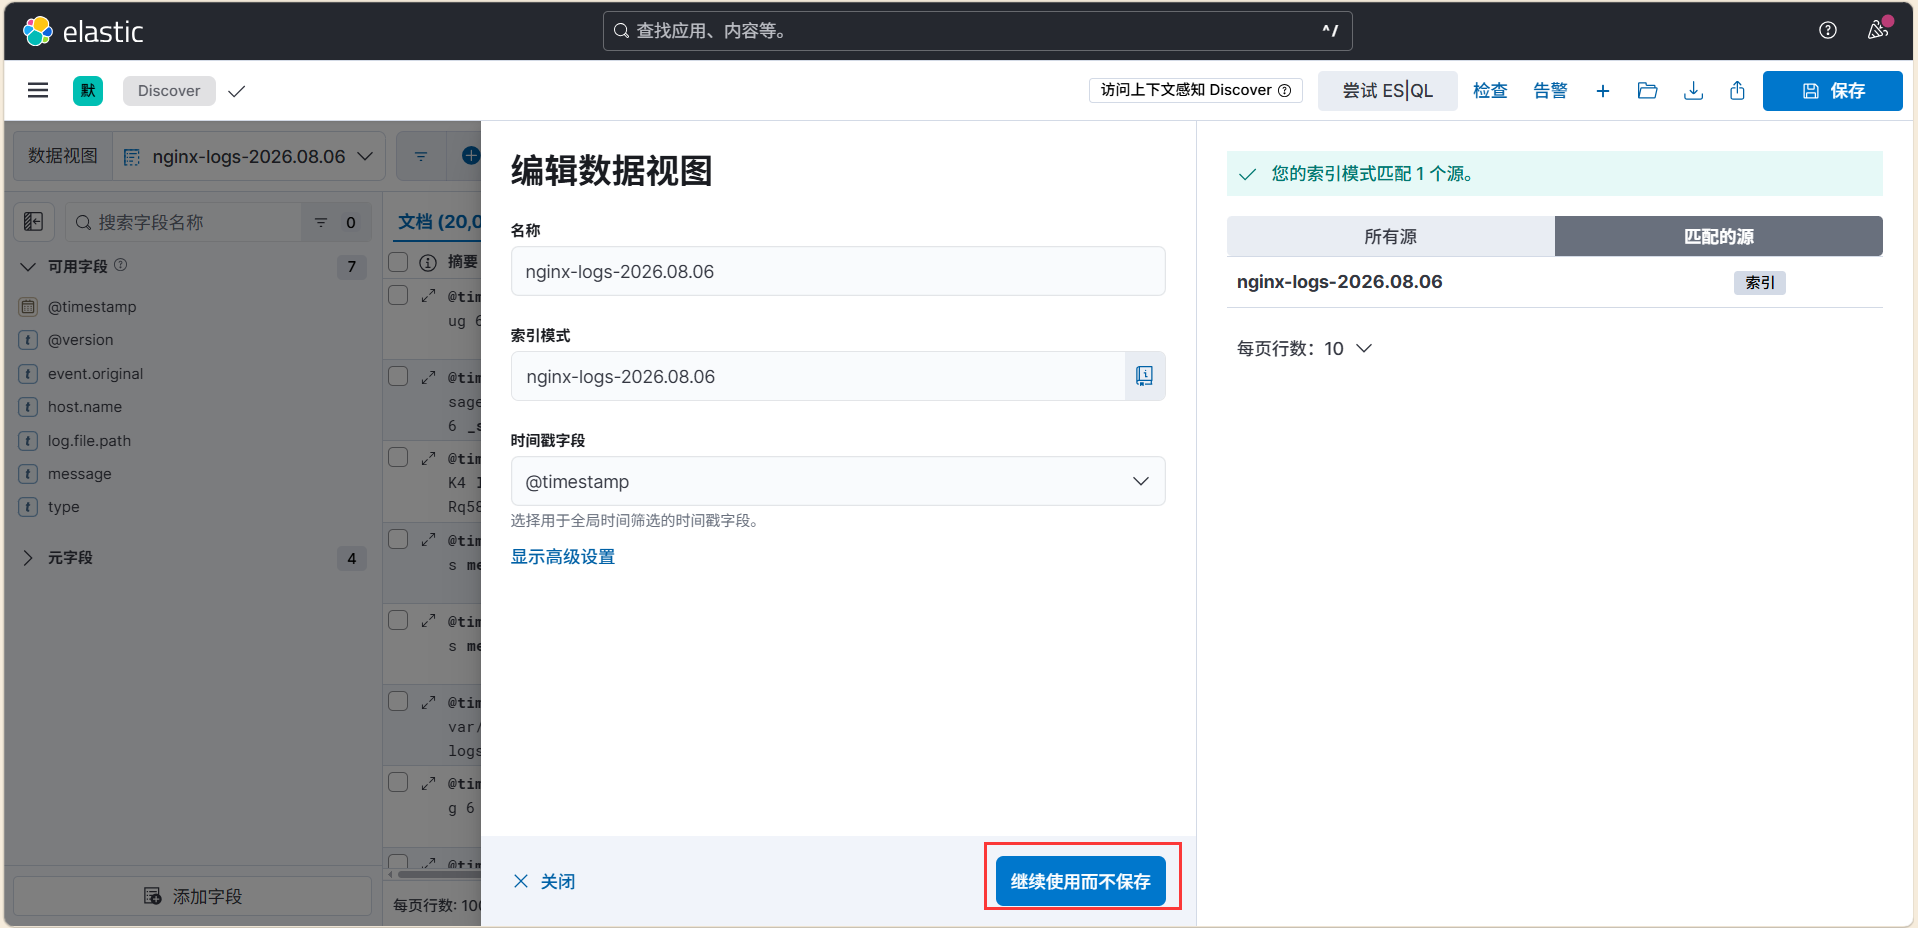
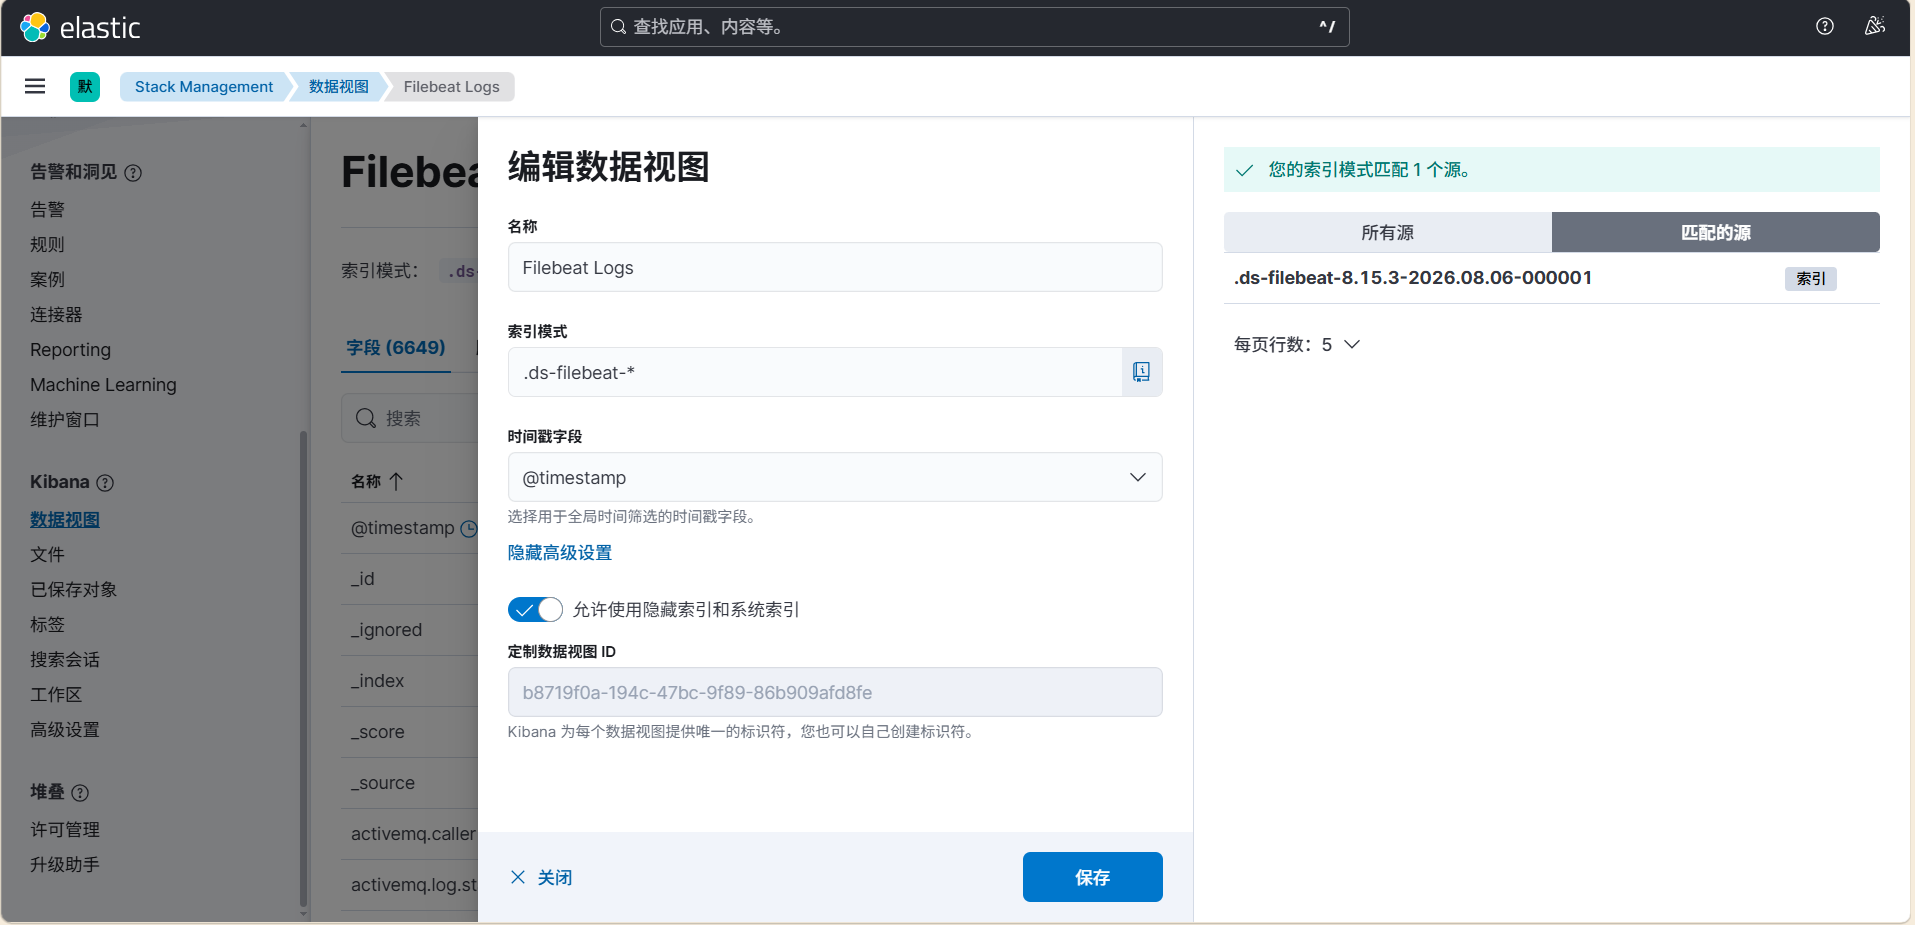
2)创建index数据视图
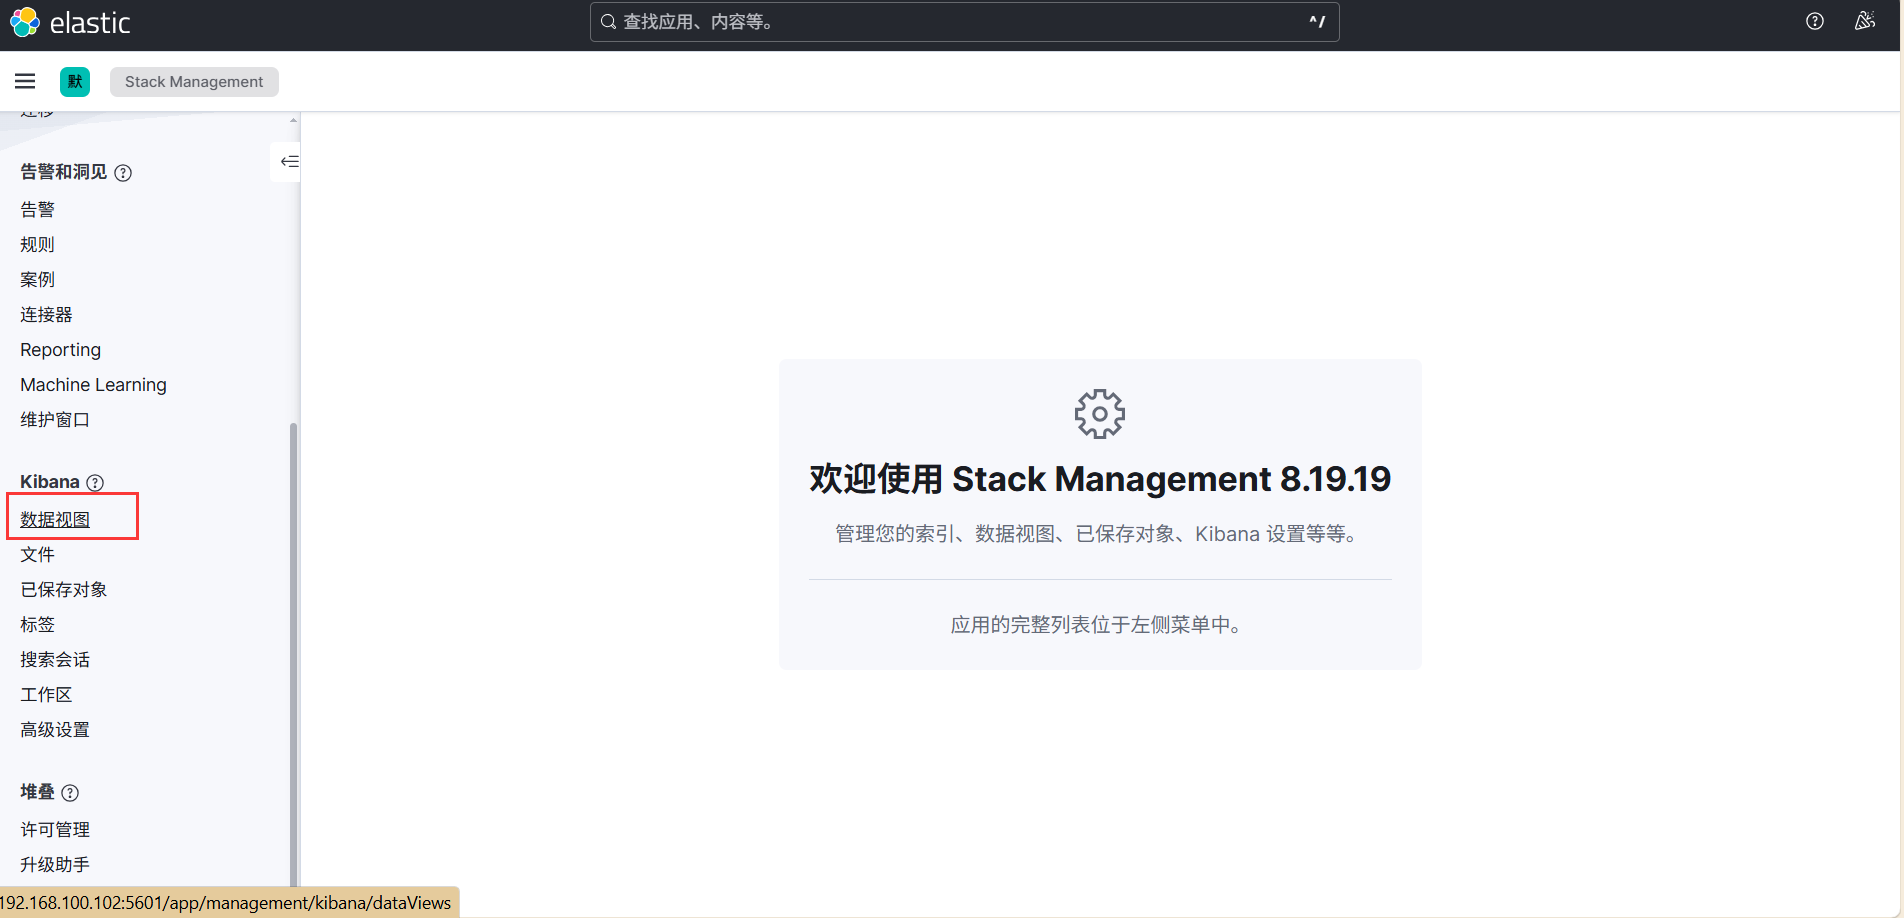
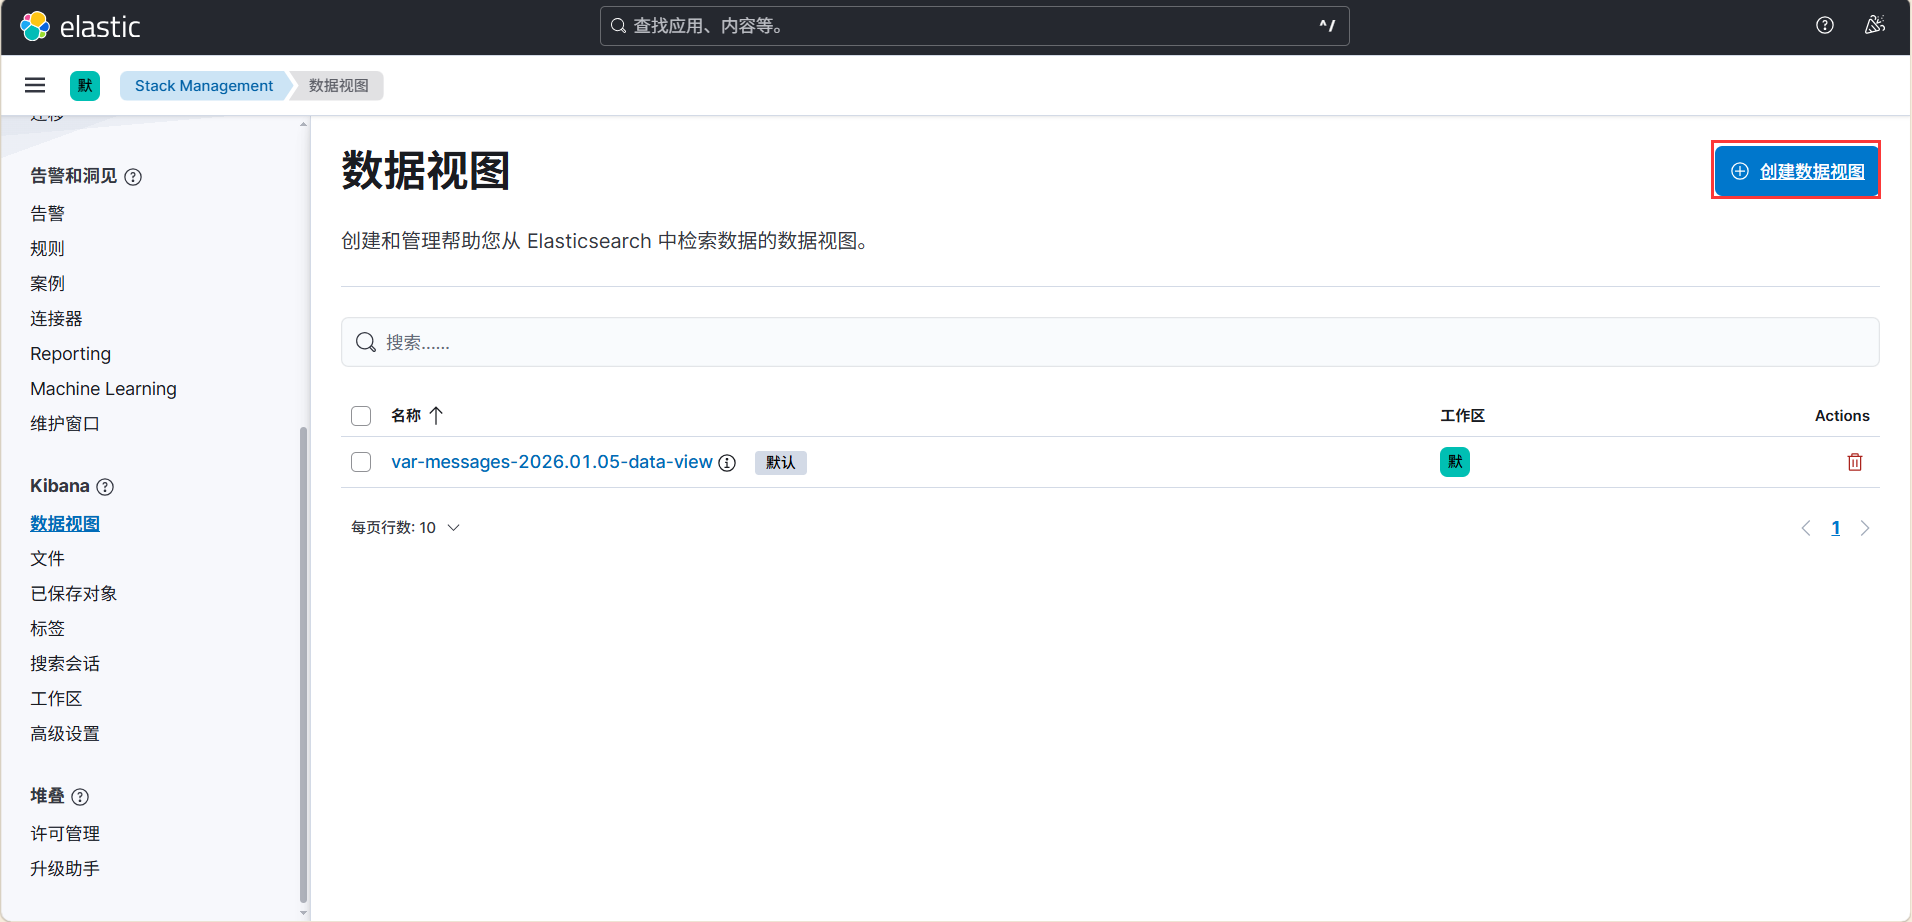
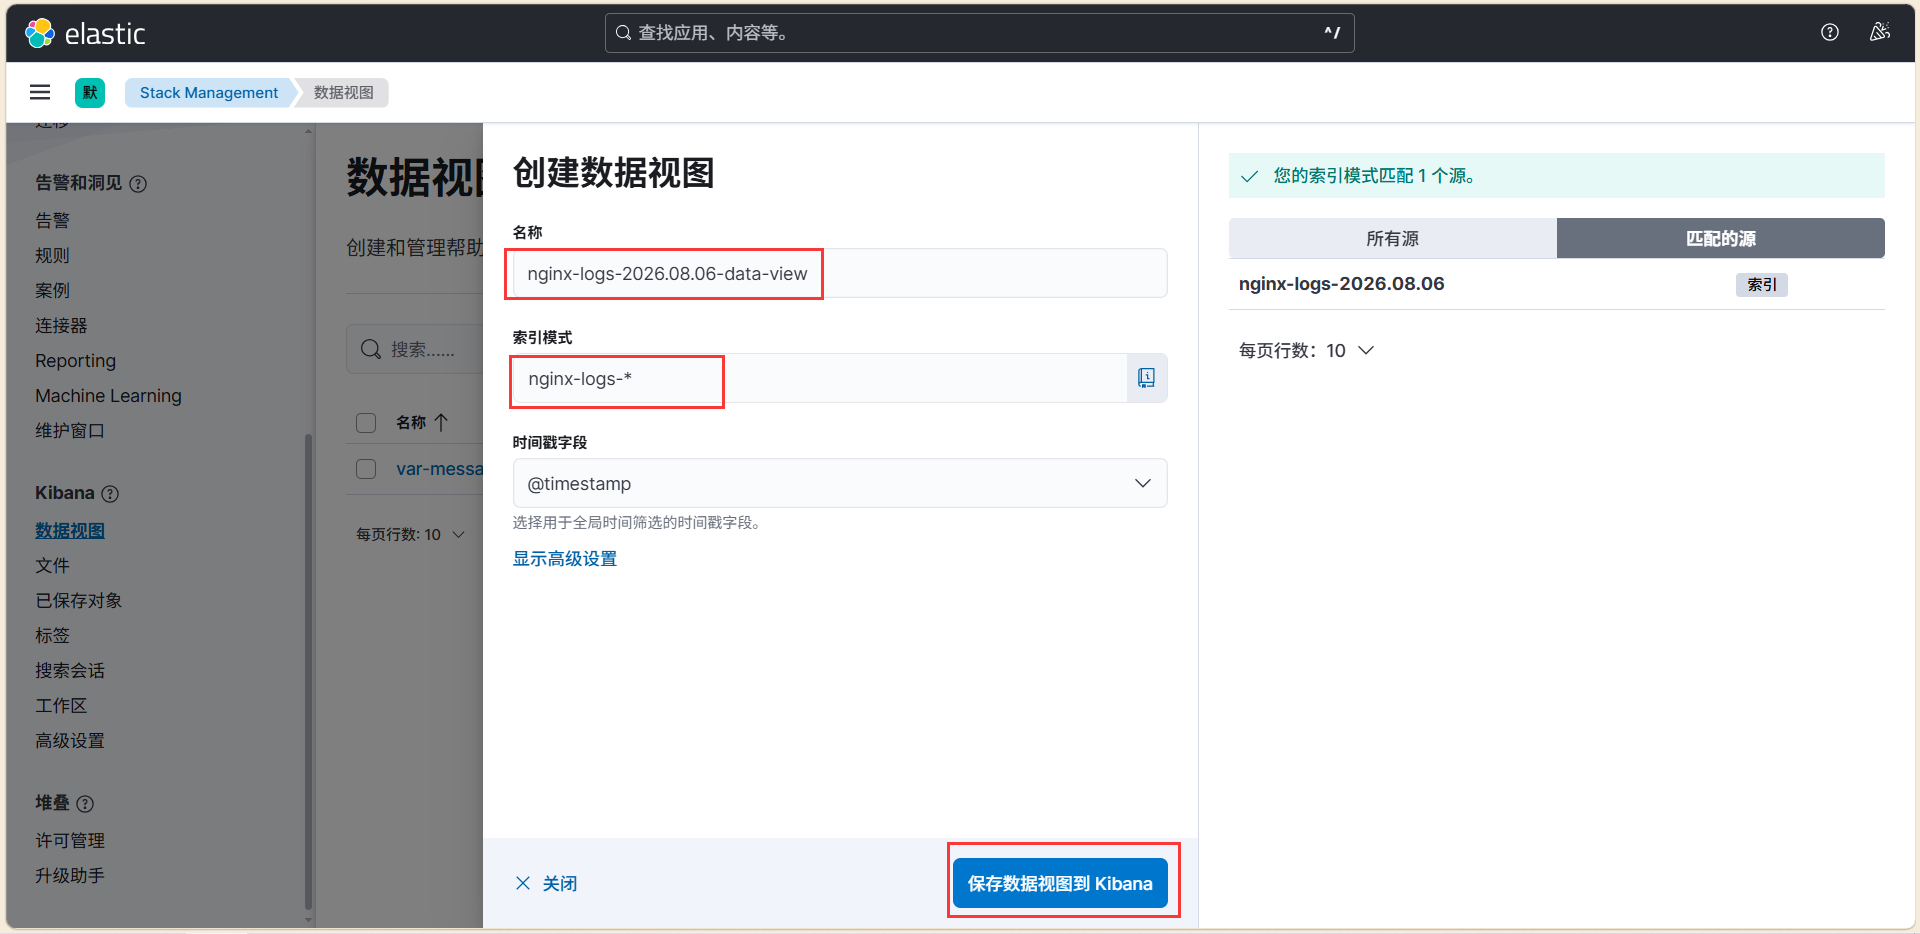
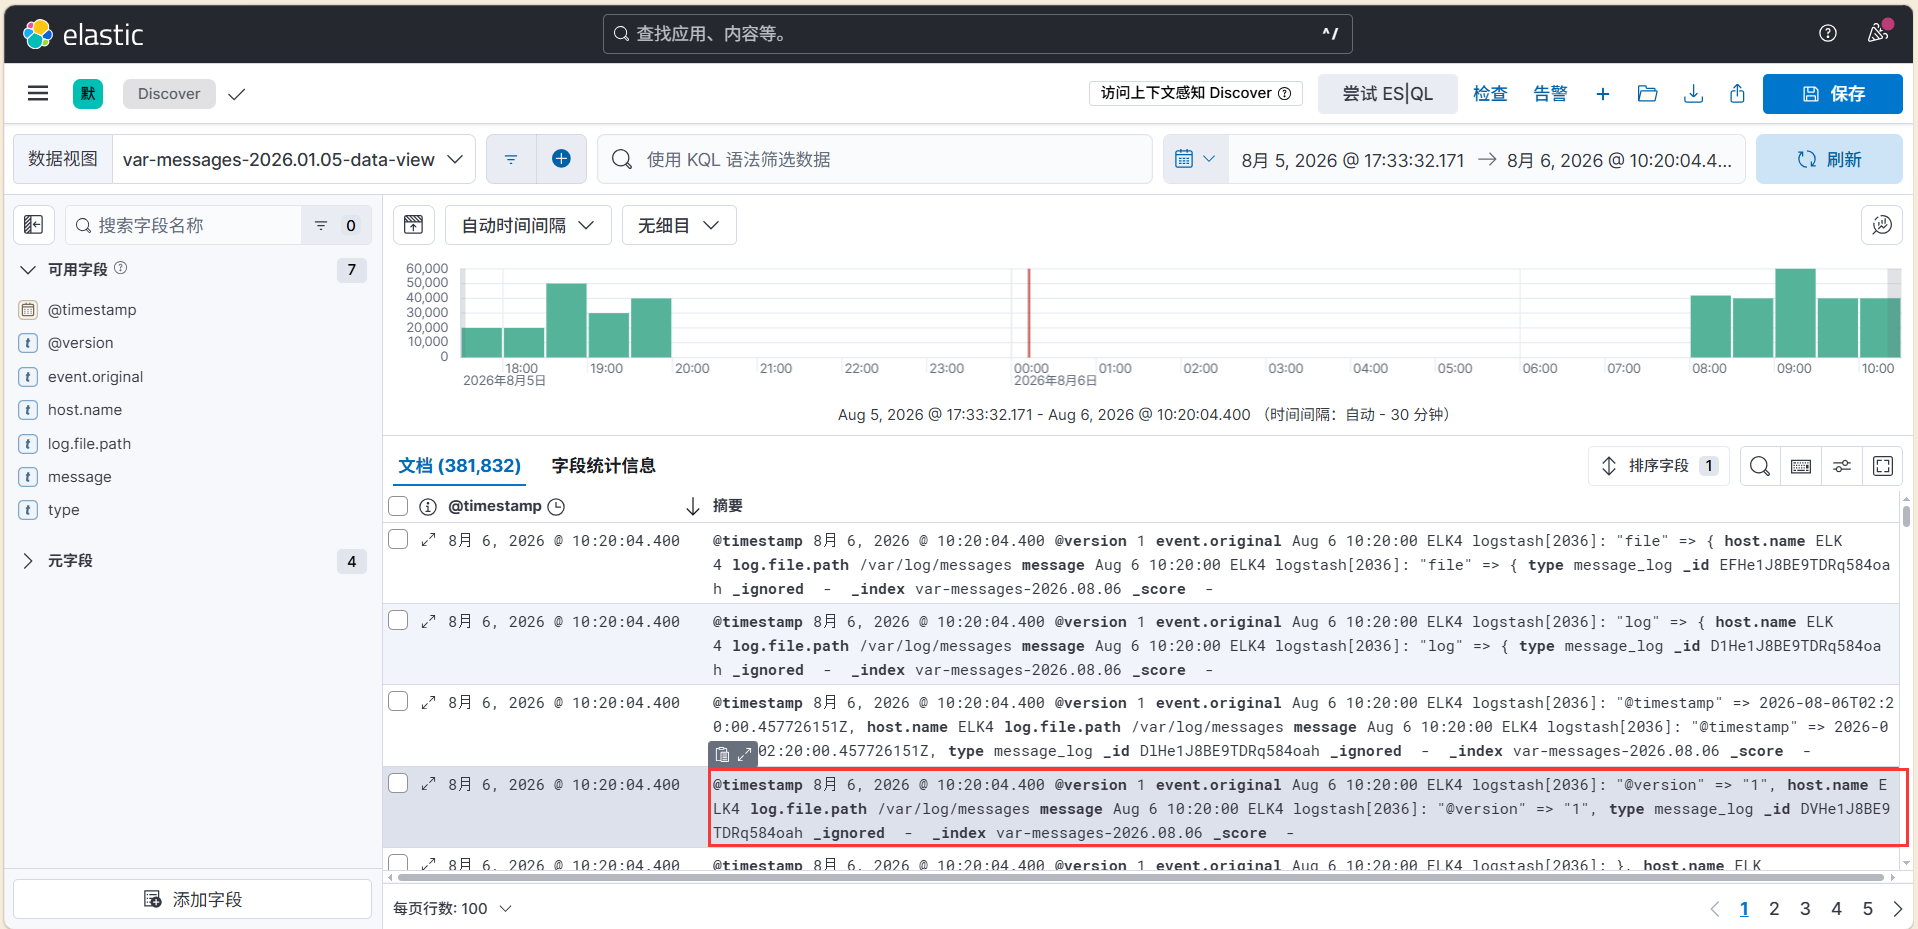
3) 查看日志
4) 添加过滤器
我们可以在搜索到的日志添加过滤器,过滤出我们想要的内容。比如我想看nginx的错误日志那么添加一个log.file.path为/var/log/nginx/error.log的过滤器。如果我们监控的服务器比较多,我们可以查看特定的主机的nginx错误日志
Ⅰ. 添加类型为log.file.path的过滤器
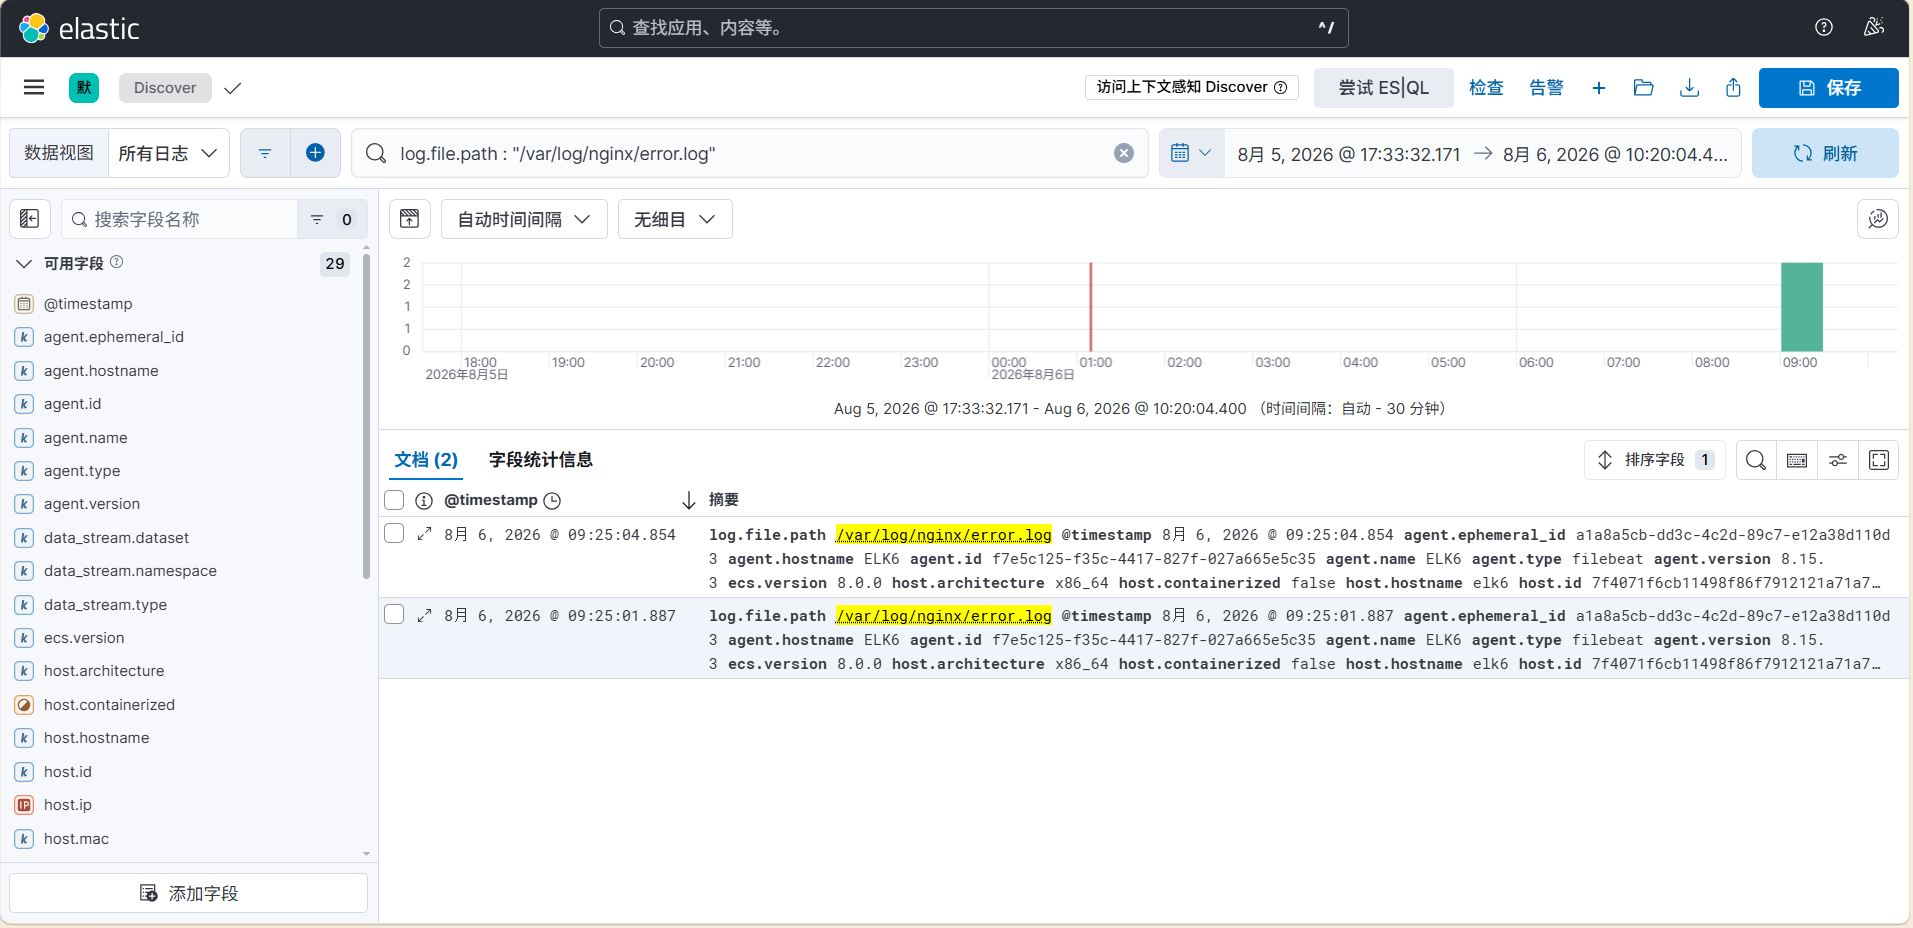
Ⅱ. 过滤出ELK6的nginx错误日志
添加类型为host.ip的过滤器
输入host.ip : "192.168.100.105"
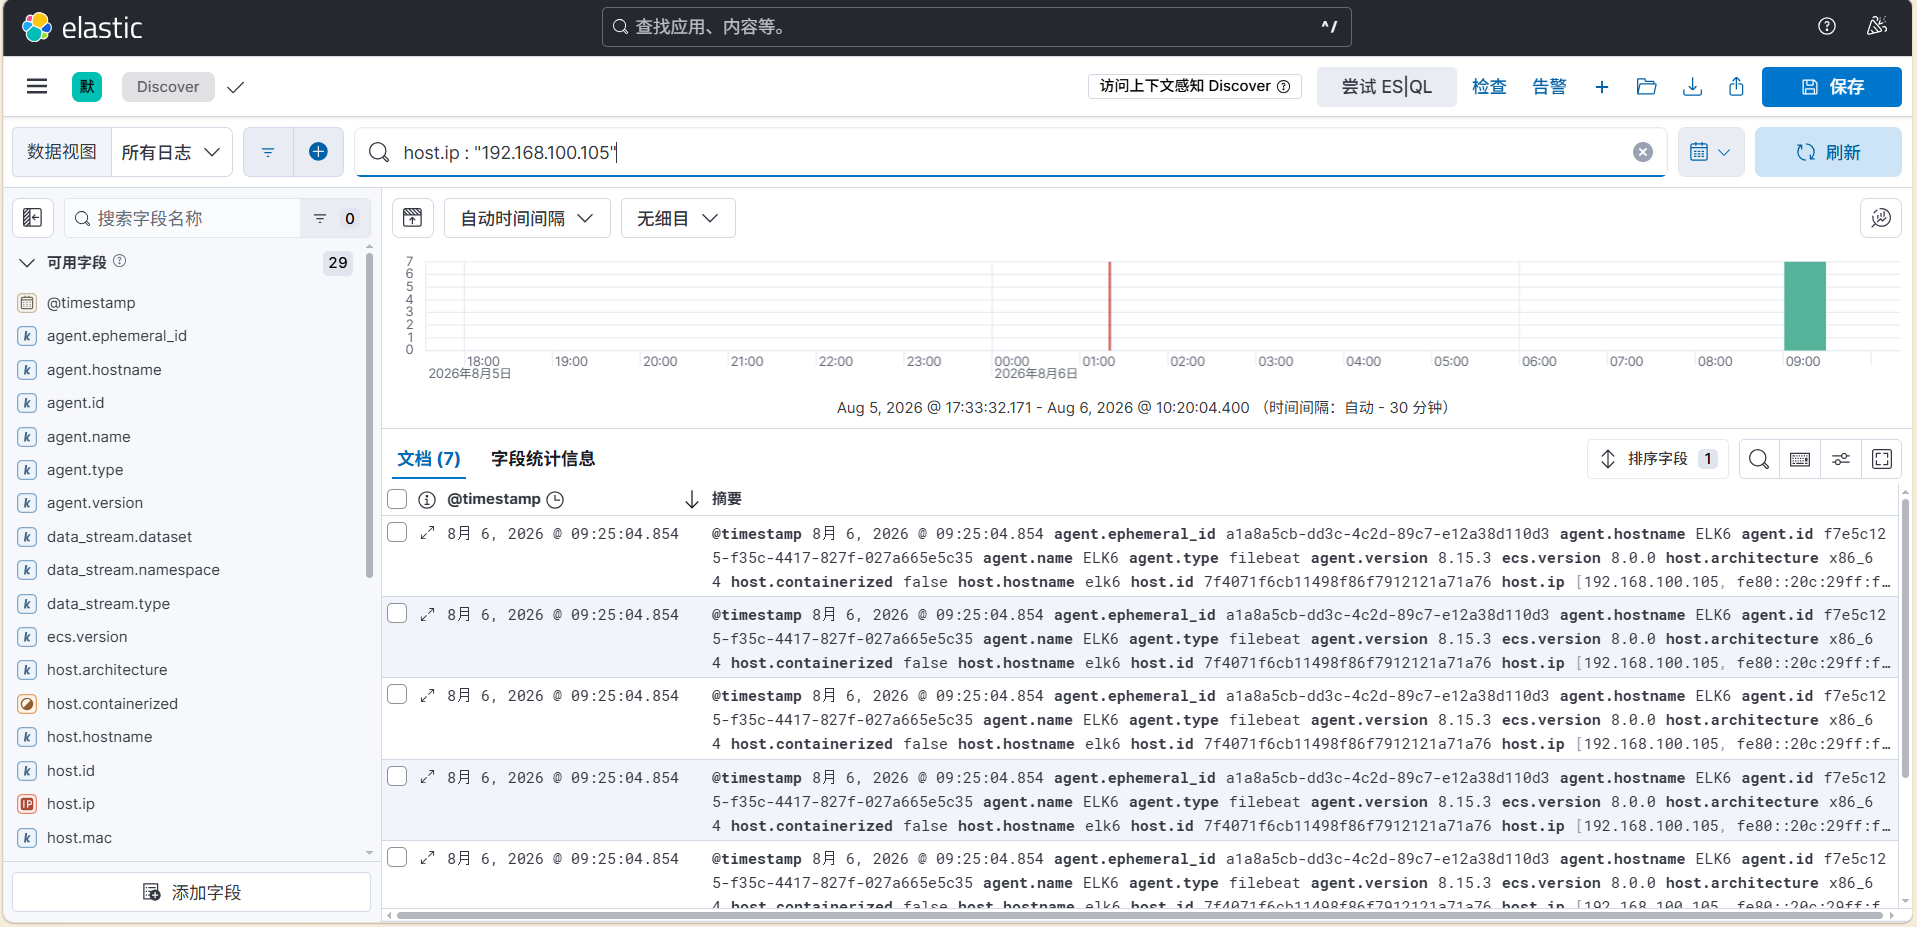
过滤的主机字段名称叫host.hostname,添加host.hostname为elk6的过滤器,所有过滤器字段再现实的日志上可以看到
输入host.hostname : "elk6"
# 注: hostname 字段存的是小写,即使主机名是大写。搜索时候keyword 字段是严格区分大小写的。所以这里要搜小写的elk
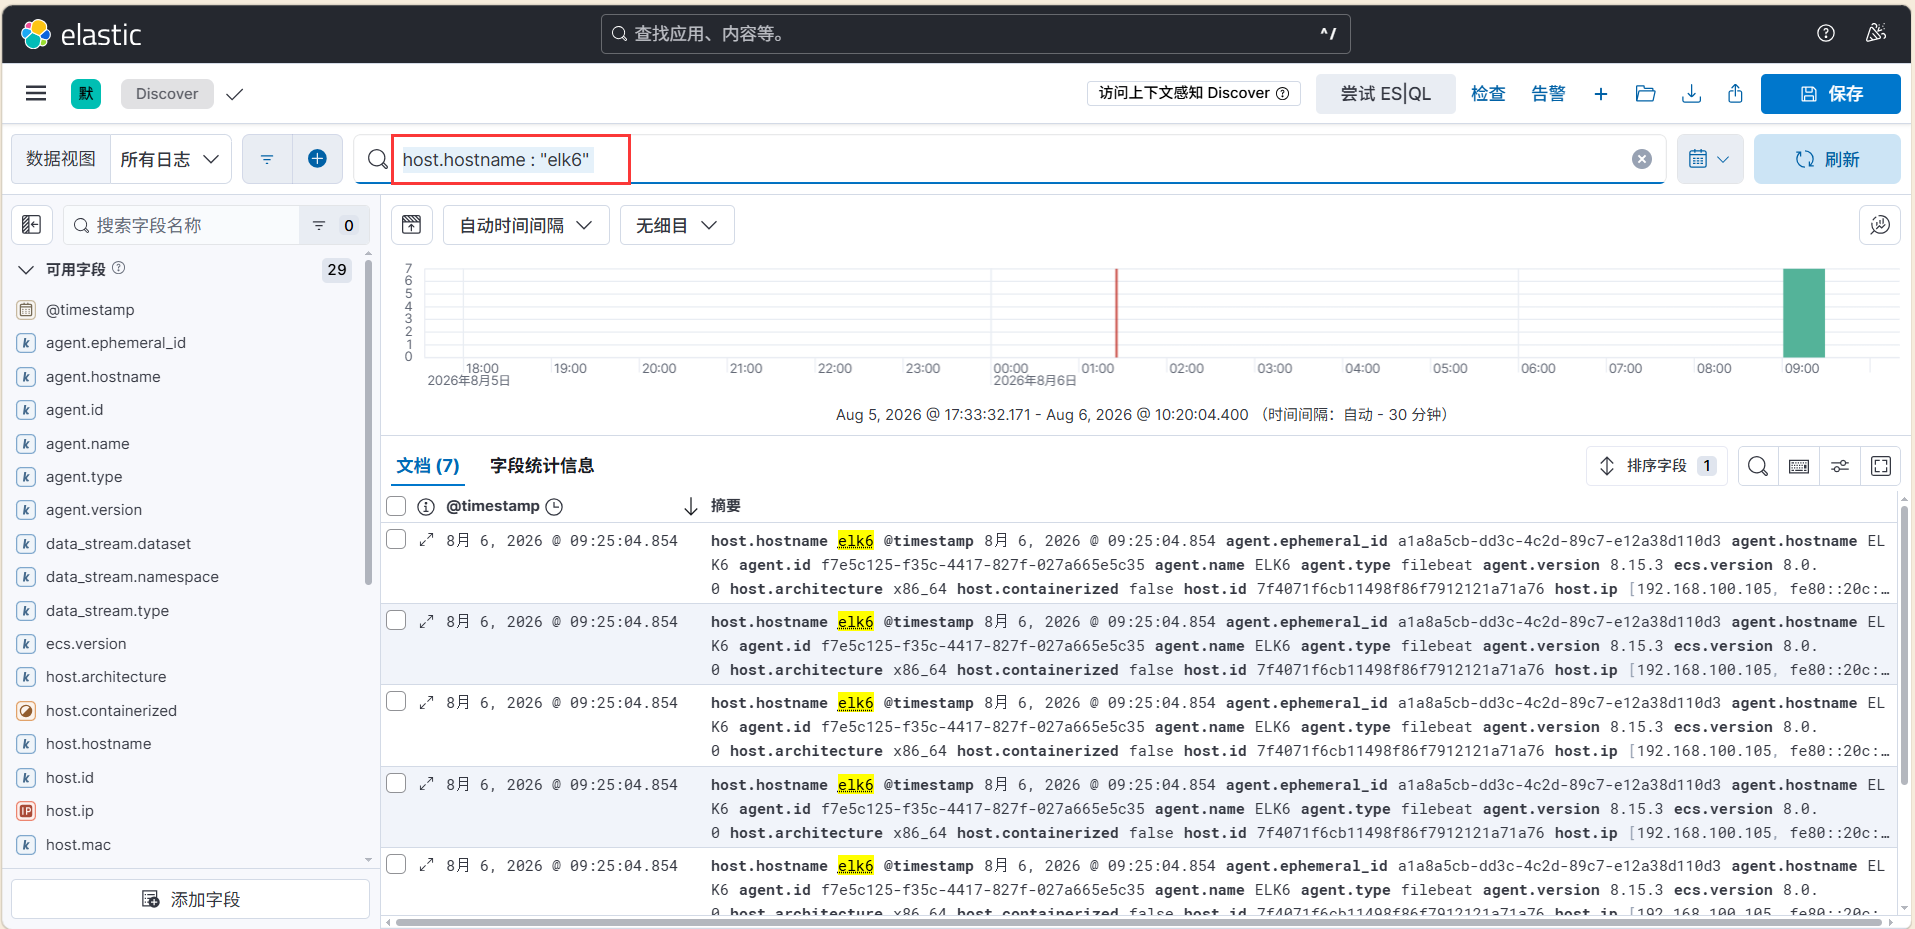
至此,ELK+filebeat部署完成
三. 部署Kafka
为了防止收集的日志信息太多或者是服务器down机导致信息丢失,需要引入Kafka消息队列服务器。现在先搭建单节点的Kafka。生产环境中应当使用集群方式部署,详细过程参考 Kafka概述
0. 安装时间同步和修改服务器名称并写入hossts
hostnamectl set-hostname ELK7
cat << EOF | tee -a /etc/hosts
192.168.100.102 ELK4
192.168.100.105 ELK6
192.168.100.106 ELK7
EOF
1. 部署jdk-21
wget https://download.oracle.com/java/21/latest/jdk-21_linux-x64_bin.tar.gz
tar -xf jdk-21_linux-x64_bin.tar.gz -C /usr/local
tee /etc/profile.d/java.sh << 'EOF'
  export JAVA_HOME=/usr/local/jdk-21.0.12
  export PATH=$JAVA_HOME/bin:$PATH
  export ES_JAVA_HOME=$JAVA_HOME
EOF
source /etc/profile.d/java.sh
java -version
2. 安装zookeeper
1) 下载安装包并解压
wget https://dlcdn.apache.org/zookeeper/zookeeper-3.9.5/apache-zookeeper-3.9.5-bin.tar.gz
tar xf apache-zookeeper-3.9.5-bin.tar.gz -C /usr/local/
2) 创建快照日志存放目录和事务日志存放目录
3) 生成配置文件
复制一份配置文件并改名
cp /usr/local/apache-zookeeper-3.9.5-bin/conf/zoo_sample.cfg  /usr/local/apache-zookeeper-3.9.5-bin/conf/zoo.cfg
vi zoo.cfg
我们需要修改的有以下几行
可以使用以下命令修改(方法1)
sed -i -e 's@dataDir=/tmp/zookeeper@dataDir=/data/zk/data@' \
  -e '/dataDir=/a dataLogDir=/data/zk/datalog' \
  /usr/local/apache-zookeeper-3.9.5-bin/conf/zoo.cfg
4) 添加path环境变量
cat << 'EOF'|tee -a /etc/profile
  export ZOOKEEPER_HOME=/usr/local/apache-zookeeper-3.9.5-bin
  export PATH=$ZOOKEEPER_HOME/bin:$PATH
EOF
source /etc/profile
5) 测试是否安装成功,然后启动
[root@ELK7 ~]# echo $ZOOKEEPER_HOME
/usr/local/apache-zookeeper-3.9.5-bin
[root@ELK7 ~]# zkServer.sh start
ZooKeeper JMX enabled by default
Using config: /usr/local/apache-zookeeper-3.9.5-bin/bin/../conf/zoo.cfg
Starting zookeeper ... STARTED
[root@ELK7 ~]# zkServer.sh status
ZooKeeper JMX enabled by default
Using config: /usr/local/apache-zookeeper-3.9.5-bin/bin/../conf/zoo.cfg
Client port found: 2181. Client address: localhost. Client SSL: false.
Mode: standalone
6) 添加开机自启动
我们可以在/lib/systemd/system文件夹下创建一个启动脚本zookeeper.service实现zookeeper的开机自启动
cat << 'EOF'|tee /lib/systemd/system/zookeeper.service
[Unit]
Description=Zookeeper service
After=network.target

[Service]
Type=forking
Environment="JAVA_HOME=/usr/local/jdk-21.0.12"
User=root
Group=root
ExecStart=/usr/local/apache-zookeeper-3.9.5-bin/bin/zkServer.sh start
ExecStop=/usr/local/apache-zookeeper-3.9.5-bin/bin/zkServer.sh stop

[Install]
WantedBy=multi-user.target
EOF

systemctl daemon-reload
systemctl enable zookeeper
3. 安装Kafka
1) 从官网下载二进制包
wget -O kafka_2.12-3.9.1.tgz https://archive.apache.org/dist/kafka/3.9.1/kafka_2.12-3.9.1.tgz
tar xf kafka_2.12-3.9.1.tgz -C /usr/local/
2) 修改配置文件
我们需要改的行有
可以执行以下命令(方法1)
sed -i -e 's@#listeners=PLAINTEXT://:9092@listeners=PLAINTEXT://:9092@' \
  -e '$a default.replication.factor=1' \
  /usr/local/kafka_2.12-3.9.1/config/server.properties
或者直接粘贴(方法2)
broker.id=0
listeners=PLAINTEXT://:9092
num.network.threads=3
num.io.threads=8
socket.send.buffer.bytes=102400
socket.receive.buffer.bytes=102400
socket.request.max.bytes=104857600
log.dirs=/tmp/kafka-logs
num.partitions=1
num.recovery.threads.per.data.dir=1
offsets.topic.replication.factor=1
transaction.state.log.replication.factor=1
transaction.state.log.min.isr=1
log.retention.hours=168
log.retention.check.interval.ms=300000
zookeeper.connect=localhost:2181
zookeeper.connection.timeout.ms=18000
group.initial.rebalance.delay.ms=0
default.replication.factor=1
3) 创建日志目录
4) 添加path环境变量
cat << 'EOF'|tee -a /etc/profile
export KAFKA_HOME=/usr/local/kafka_2.12-3.9.1
export PATH=$KAFKA_HOME/bin:$PATH
EOF
source /etc/profile
5) 启动Kafka
后台启动
6) 添加开机自启动
同zookeeper添加开机自启动 ,我们也可以写入启动脚本/lib/systemd/system/kafka.service
cat << 'EOF'|tee -a /lib/systemd/system/kafka.service
[Unit]
Description=Apache Kafka server (broker)
After=network.target zookeeper.service

[Service]
Type=simple
Environment="PATH=/usr/local/jdk-21.0.12/bin:/usr/local/sbin:/usr/local/bin:/usr/sbin:/usr/bin:/root/bin"
User=root
Group=root
ExecStart=/usr/local/kafka_2.12-3.9.1/bin/kafka-server-start.sh /usr/local/kafka_2.12-3.9.1/config/server.properties
ExecStop=/usr/local/kafka_2.12-3.9.1/bin/kafka-server-stop.sh /usr/local/kafka_2.12-3.9.1/config/server.properties
Restart=on-failure

[Install]
WantedBy=multi-user.target
EOF

systemctl daemon-reload
systemctl enable kafka
四. 回到ELK设置filebeat
1. 修改配置文件
修改/usr/local/filebeat/filebeat.yml文件
我们需要修改的内容有:
# ----------------------------- 以上下行需要注释掉 -----------------------------
output.elasticsearch:                   # es输出,因为要输出到mq上所以没用了注释掉
  hosts: ["192.168.100.102:9200"]       # 同上
filebeat.config.modules:                # ssh登录日志收集,影响观看,注释掉
  path: ${path.config}/modules.d/*.yml  # 上面所需要的模块,关掉上面就没用了
  reload.enabled: true                  # 同上
setup.template.settings:                # 给ES输出用的,不使用ES一起关掉
  index.number_of_shards: 1             # 同上
setup.kibana:                           # 注释掉,仪表盘相关
# processors 中以下三行也注释掉
  - add_cloud_metadata: ~               # 云相关
  - add_docker_metadata: ~              # 容器相关
  - add_kubernetes_metadata: ~          # k8s相关

# ------------------------------ 并添加如下几行 ------------------------------
# ------------------------------ KAFKA output -------------------------------
output.kafka:
# 把日志发送给kafka
  enabled: true
  # 开启fafka模块
  hosts: ["192.168.100.106:9092"]
  # kafka服务器的地址
  topic: nginx_logs
  # 填写kafka的topic(即主题),可以自定义
可以使用如下命令(方法1)
sed -i  -e 's@output\.elasticsearch:@#output.elasticsearch:@' \
  -e 's@hosts: \["192.168.100.102:9200"\]@#hosts: ["192.168.100.102:9200"]@' \
  -e 's@filebeat\.config\.modules:@#filebeat.config.modules:@' \
  -e 's@path:.*@#path: ${path.config}/modules.d/*.yml@' \
  -e 's@reload\.enabled: true@#reload.enabled: true@' \
  -e 's@setup\.template\.settings:@#setup.template.settings:@' \
  -e 's@index.number_of_shards: 1@#index.number_of_shards: 1@' \
  -e 's@setup\.kibana:@#setup.kibana:@' \
  -e 's@- add_cloud_metadata: ~@#- add_cloud_metadata: ~@' \
  -e 's@- add_docker_metadata: ~@#- add_docker_metadata: ~@' \
  -e 's@- add_kubernetes_metadata: ~@#- add_kubernetes_metadata: ~@' \
/usr/local/filebeat/filebeat.yml

cat << 'EOF'|tee -a /usr/local/filebeat/filebeat.yml
# ------------------------------ KAFKA output -------------------------------
output.kafka:
# 把日志发送给kafka
  enabled: true
  # 开启fafka模块
  hosts: ["192.168.100.106:9092"]
  # kafka服务器的地址
  topic: nginx_logs
  # 填写kafka的topic(即主题),可以自定义
EOF
grep -Ev '^#|^$|^[[:space:]]+#' /usr/local/filebeat/filebeat.yml也可以把下面的内容粘贴进去(方法2)
filebeat.inputs:
- type: log
  id: my-filestream-id
  enabled: true
  paths:
    - /var/log/nginx/*.log
logging.level: warning
processors:
  - add_host_metadata:
      when.not.contains.tags: forwarded
output.kafka:
  enabled: true
  hosts: ["192.168.100.106:9092"]
  topic: nginx_logs
# 注: - type: log在 Filebeat 8.x 里已经是弃用的,推荐用- type: filestream。教程因为是基于 8.15 写的所以用 log,目前还能用。以后重装新版注意改过来。
2. 重启filebeat
[root@ELK6 ~]# ps -elf|grep 'filebeat'|grep -v 'grep'
0 S root        1367    1334  0  80   0 - 483282 futex_ 08:30 pts/0   00:00:02 ./filebeat -e -c filebeat.yml
[root@ELK6 ~]# kill 1367
[root@ELK6 ~]# cd /usr/local/filebeat/ && ./filebeat -e -c filebeat.yml
令起一终端查看
[root@ELK6 ~]# ps -elf|grep 'filebeat'|grep -v 'grep'
0 S root        1533    1418  0  80   0 - 464785 futex_ 11:09 pts/1   00:00:00 ./filebeat -e -c filebeat.yml
五. 查看kafka上所有topic信息
1.在kafka服务器上查看filebeat保存的数据,topic为nginx_logs
在kafka较新的版本(2.2以及更改版本)不再需要ZooKeeper连接字符串,即: --zookeeper localhost:2181。需要使用Kafka Broker的 --bootstrap-server localhost:9092来替代
# 先创建nginx_logs这个topic
[root@ELK7 ~]# cd /usr/local/kafka_2.12-3.9.1/bin/
[root@ELK7 bin]# kafka-topics.sh --list --bootstrap-server localhost:9092
nginx_logs
2. 启动一个消费者获取信息
[root@ELK7 bin]# kafka-console-consumer.sh --bootstrap-server localhost:9092 --topic nginx_logs --from-beginning
{"@timestamp":"2026-08-07T03:32:16.848Z","@metadata":{"beat":"filebeat","type":"_doc","version":"8.15.3"},"log":{"offset":0,"file":{"path":"/var/log/nginx/error.log"}},"message":"test to kafka 2026年 08月 07日 星期五 11:32:09 CST","input":{"type":"log"},"ecs":{"version":"8.0.0"},"host":{"os":{"codename":"Blue Onyx","type":"linux","platform":"rocky","version":"9.6 (Blue Onyx)","family":"redhat","name":"Rocky Linux","kernel":"5.14.0-570.17.1.el9_6.x86_64"},"id":"7f4071f6cb11498f86f7912121a71a76","containerized":false,"ip":["192.168.100.105","fe80::20c:29ff:fe49:2f40"],"mac":["00-0C-29-49-2F-40"],"name":"elk6","hostname":"elk6","architecture":"x86_64"},"agent":{"type":"filebeat","version":"8.15.3","ephemeral_id":"8d7c833e-1dae-4280-bd96-6398aed31b00","id":"f7e5c125-f35c-4417-827f-027a665e5c35","name":"ELK6"}}
{"@timestamp":"2026-08-07T03:32:31.858Z","@metadata":{"beat":"filebeat","type":"_doc","version":"8.15.3"},"agent":{"version":"8.15.3","ephemeral_id":"8d7c833e-1dae-4280-bd96-6398aed31b00","id":"f7e5c125-f35c-4417-827f-027a665e5c35","name":"ELK6","type":"filebeat"},"log":{"offset":57,"file":{"path":"/var/log/nginx/error.log"}},"message":"test to kafka 2026年 08月 07日 星期五 11:32:30 CST","input":{"type":"log"},"ecs":{"version":"8.0.0"},"host":{"name":"elk6","hostname":"elk6","architecture":"x86_64","os":{"type":"linux","platform":"rocky","version":"9.6 (Blue Onyx)","family":"redhat","name":"Rocky Linux","kernel":"5.14.0-570.17.1.el9_6.x86_64","codename":"Blue Onyx"},"id":"7f4071f6cb11498f86f7912121a71a76","containerized":false,"ip":["192.168.100.105","fe80::20c:29ff:fe49:2f40"],"mac":["00-0C-29-49-2F-40"]}}
{"@timestamp":"2026-08-07T03:32:56.863Z","@metadata":{"beat":"filebeat","type":"_doc","version":"8.15.3"},"input":{"type":"log"},"ecs":{"version":"8.0.0"},"host":{"name":"elk6","hostname":"elk6","architecture":"x86_64","os":{"codename":"Blue Onyx","type":"linux","platform":"rocky","version":"9.6 (Blue Onyx)","family":"redhat","name":"Rocky Linux","kernel":"5.14.0-570.17.1.el9_6.x86_64"},"id":"7f4071f6cb11498f86f7912121a71a76","containerized":false,"ip":["192.168.100.105","fe80::20c:29ff:fe49:2f40"],"mac":["00-0C-29-49-2F-40"]},"agent":{"id":"f7e5c125-f35c-4417-827f-027a665e5c35","name":"ELK6","type":"filebeat","version":"8.15.3","ephemeral_id":"8d7c833e-1dae-4280-bd96-6398aed31b00"},"log":{"file":{"path":"/var/log/nginx/error.log"},"offset":114},"message":"test to kafka 2026年 08月 07日 星期五 11:32:50 CST"}
启动消费者去查看filebeat发送过来的消息,能看到说明我们filebeat的output,kafka配置成功。接下类配置logstash去消费kafka的数据
六. 配置logstash
配置logstash去kafka拿去数据,进行数据格式化。然后把格式化的数据保存到ElasticSearch,通过kibana展示给用户。kibana是通过ElasticSearch进行日志搜索。
filebeat中message要么是一段字符串,要么在日志生成中拼接成json,然后再filebeat中指定为json。但是大部分系统日志无法去修改日志格式,filebeat则无法通过正则去匹配出对应的filed,这时候就需要结合logstash的grok来过滤。后面还会有logstash filter使用
1. 修改logstash配置文件
我们直接覆盖写入如下内容
cat << 'EOF'|tee /etc/logstash/conf.d/http_logstash.conf
input {
    kafka {
        codec => json
        bootstrap_servers => "192.168.100.106:9092"
        # kafka节点的地址,要带端口,默认为9092
        client_id => "httpd_logs"
        # 这里设置client和group.id是为了做标识
        group_id => "httpd_logs"
        consumer_threads => 5
        # 设置消费kafka数据时开启的线程数,一个partition对应一个消费者消费。设置多个不影响,在Kafka中一个进程对应一个线程
        auto_offset_reset => "latest"
        # 从最新的偏移量开始消费
        decorate_events => true
        # 此属性会将当前topic,offset,group,partition等信息也带到message中
        topics => "nginx_logs"
    }
}

output {
    stdout {
        codec => "rubydebug"
    }
    elasticsearch {
        hosts => ["192.168.100.102:9200"]
        index => "nginx-logs-%{+yyyy.MM.dd}"
    }
}

EOF
可以使用相同的group_id方式运行多个Logstash实例,以跨物理机分布负载。主题中的消息将发布到具有相同的所有Logstash实例group_id
2. 语法测试,无误后启动服务
[root@ELK4 ~]# /usr/share/logstash/bin/logstash -t --path.settings /etc/logstash
Using bundled JDK: /usr/share/logstash/jdk
Sending Logstash logs to /var/log/logstash which is now configured via log4j2.properties
[2026-08-07T17:29:18,997][WARN ][logstash.runner          ] NOTICE: Running Logstash as a superuser is strongly discouraged as it poses a security risk. Set 'allow_superuser' to false for better security.
[2026-08-07T17:29:19,007][INFO ][logstash.runner          ] Log4j configuration path used is: /etc/logstash/log4j2.properties
[2026-08-07T17:29:19,009][INFO ][logstash.runner          ] Starting Logstash {"logstash.version"=>"8.19.19", "jruby.version"=>"jruby 9.4.15.0 (3.1.7) 2026-06-08 6114208a31 OpenJDK 64-Bit Server VM 21.0.11+10-LTS on 21.0.11+10-LTS +indy +jit [x86_64-linux]"}
[2026-08-07T17:29:19,013][INFO ][logstash.runner          ] JVM bootstrap flags: [-Xms512m, -Xmx512m, -Djava.awt.headless=true, -Dfile.encoding=UTF-8, -Djruby.compile.invokedynamic=true, -XX:+HeapDumpOnOutOfMemoryError, -Djava.security.egd=file:/dev/urandom, -Dlog4j2.isThreadContextMapInheritable=true, -Djruby.regexp.interruptible=true, -Djdk.io.File.enableADS=true, --add-exports=jdk.compiler/com.sun.tools.javac.api=ALL-UNNAMED, --add-exports=jdk.compiler/com.sun.tools.javac.file=ALL-UNNAMED, --add-exports=jdk.compiler/com.sun.tools.javac.parser=ALL-UNNAMED, --add-exports=jdk.compiler/com.sun.tools.javac.tree=ALL-UNNAMED, --add-exports=jdk.compiler/com.sun.tools.javac.util=ALL-UNNAMED, --add-opens=java.base/java.security=ALL-UNNAMED, --add-opens=java.base/java.io=ALL-UNNAMED, --add-opens=java.base/java.nio.channels=ALL-UNNAMED, --add-opens=java.base/sun.nio.ch=ALL-UNNAMED, --add-opens=java.management/sun.management=ALL-UNNAMED, -Dio.netty.allocator.maxOrder=11]
[2026-08-07T17:29:19,076][INFO ][org.logstash.jackson.StreamReadConstraintsUtil] Jackson default value override `logstash.jackson.stream-read-constraints.max-string-length` configured to `200000000` (logstash default)
[2026-08-07T17:29:19,079][INFO ][org.logstash.jackson.StreamReadConstraintsUtil] Jackson default value override `logstash.jackson.stream-read-constraints.max-number-length` configured to `10000` (logstash default)
[2026-08-07T17:29:19,080][INFO ][org.logstash.jackson.StreamReadConstraintsUtil] Jackson default value override `logstash.jackson.stream-read-constraints.max-nesting-depth` configured to `1000` (logstash default)
[2026-08-07T17:29:20,444][INFO ][org.reflections.Reflections] Reflections took 201 ms to scan 1 urls, producing 150 keys and 530 values
[2026-08-07T17:29:21,123][INFO ][logstash.javapipeline    ] Pipeline `main` is configured with `pipeline.ecs_compatibility: v8` setting. All plugins in this pipeline will default to `ecs_compatibility => v8` unless explicitly configured otherwise.
Configuration OK
[2026-08-07T17:29:21,124][INFO ][logstash.runner          ] Using config.test_and_exit mode. Config Validation Result: OK. Exiting Logstash
[root@ELK4 ~]# systemctl restart logstash
3. 访问nginx界面,并刷新产生数据
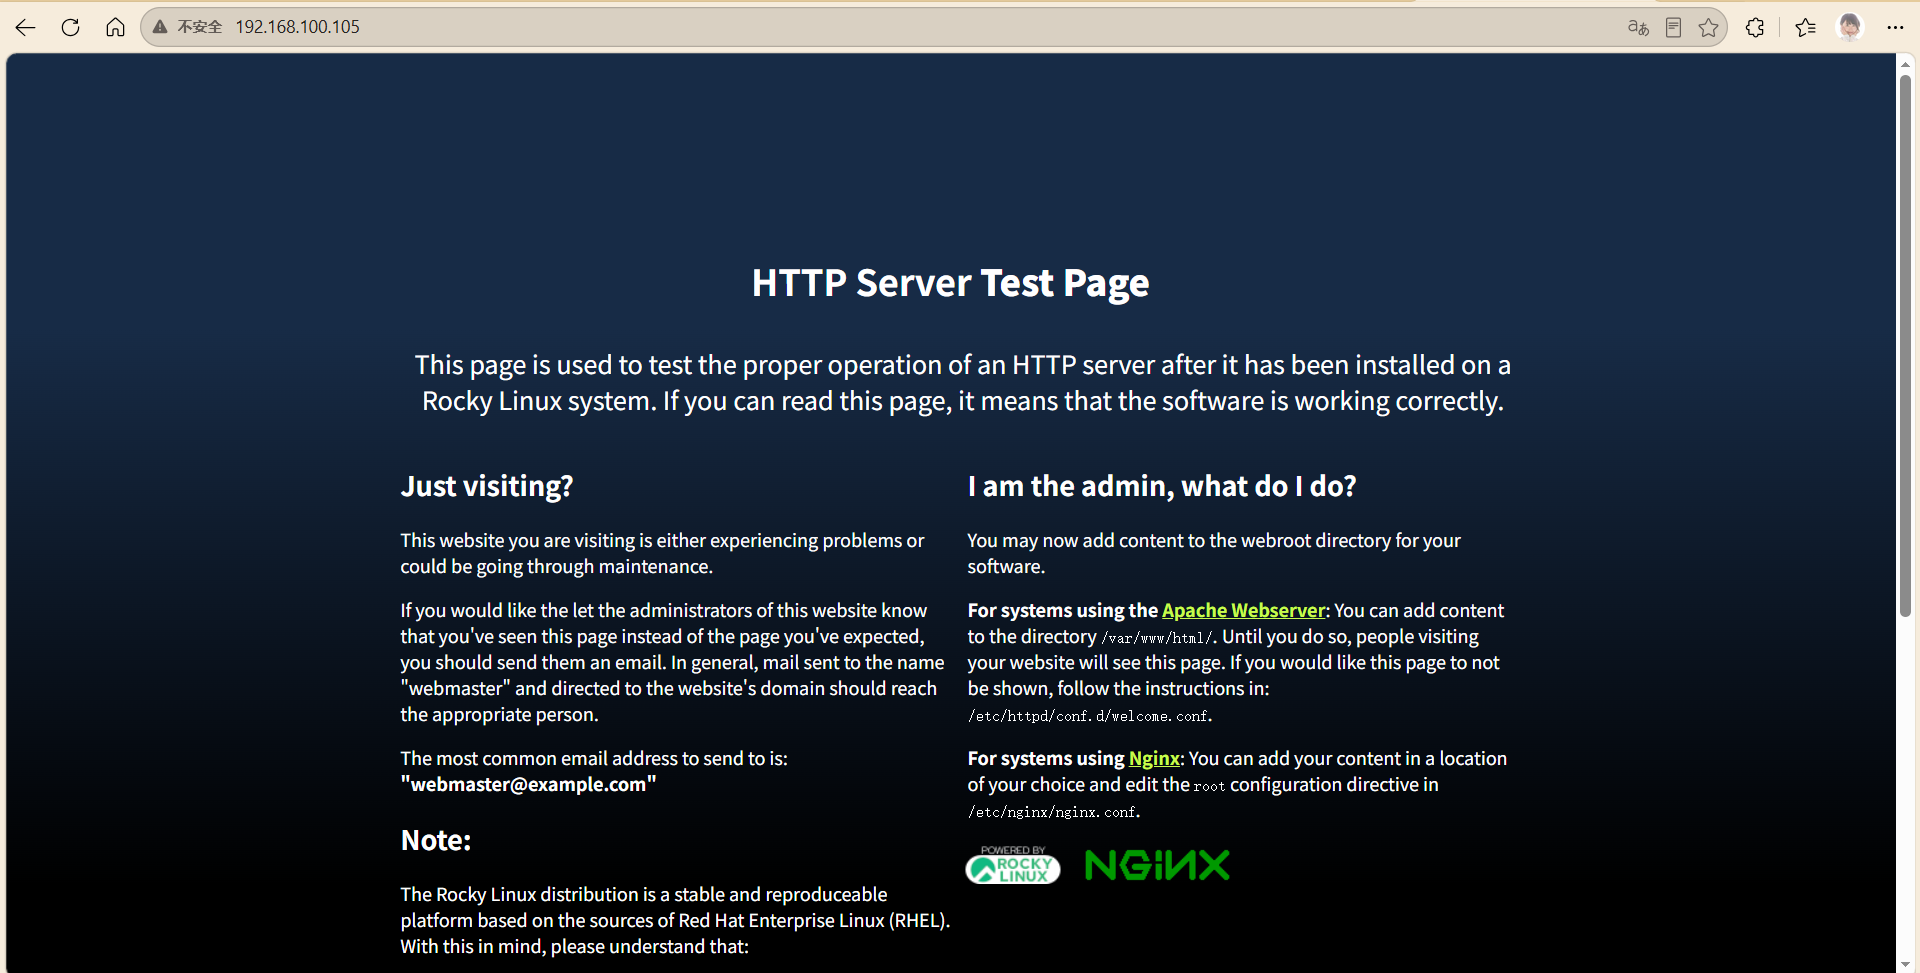
访问nginx界面,并刷新产生数据nginx: http://192.168.100.105:80
4. 查看kibana上的数据
nginx: http://192.168.100.102:5601
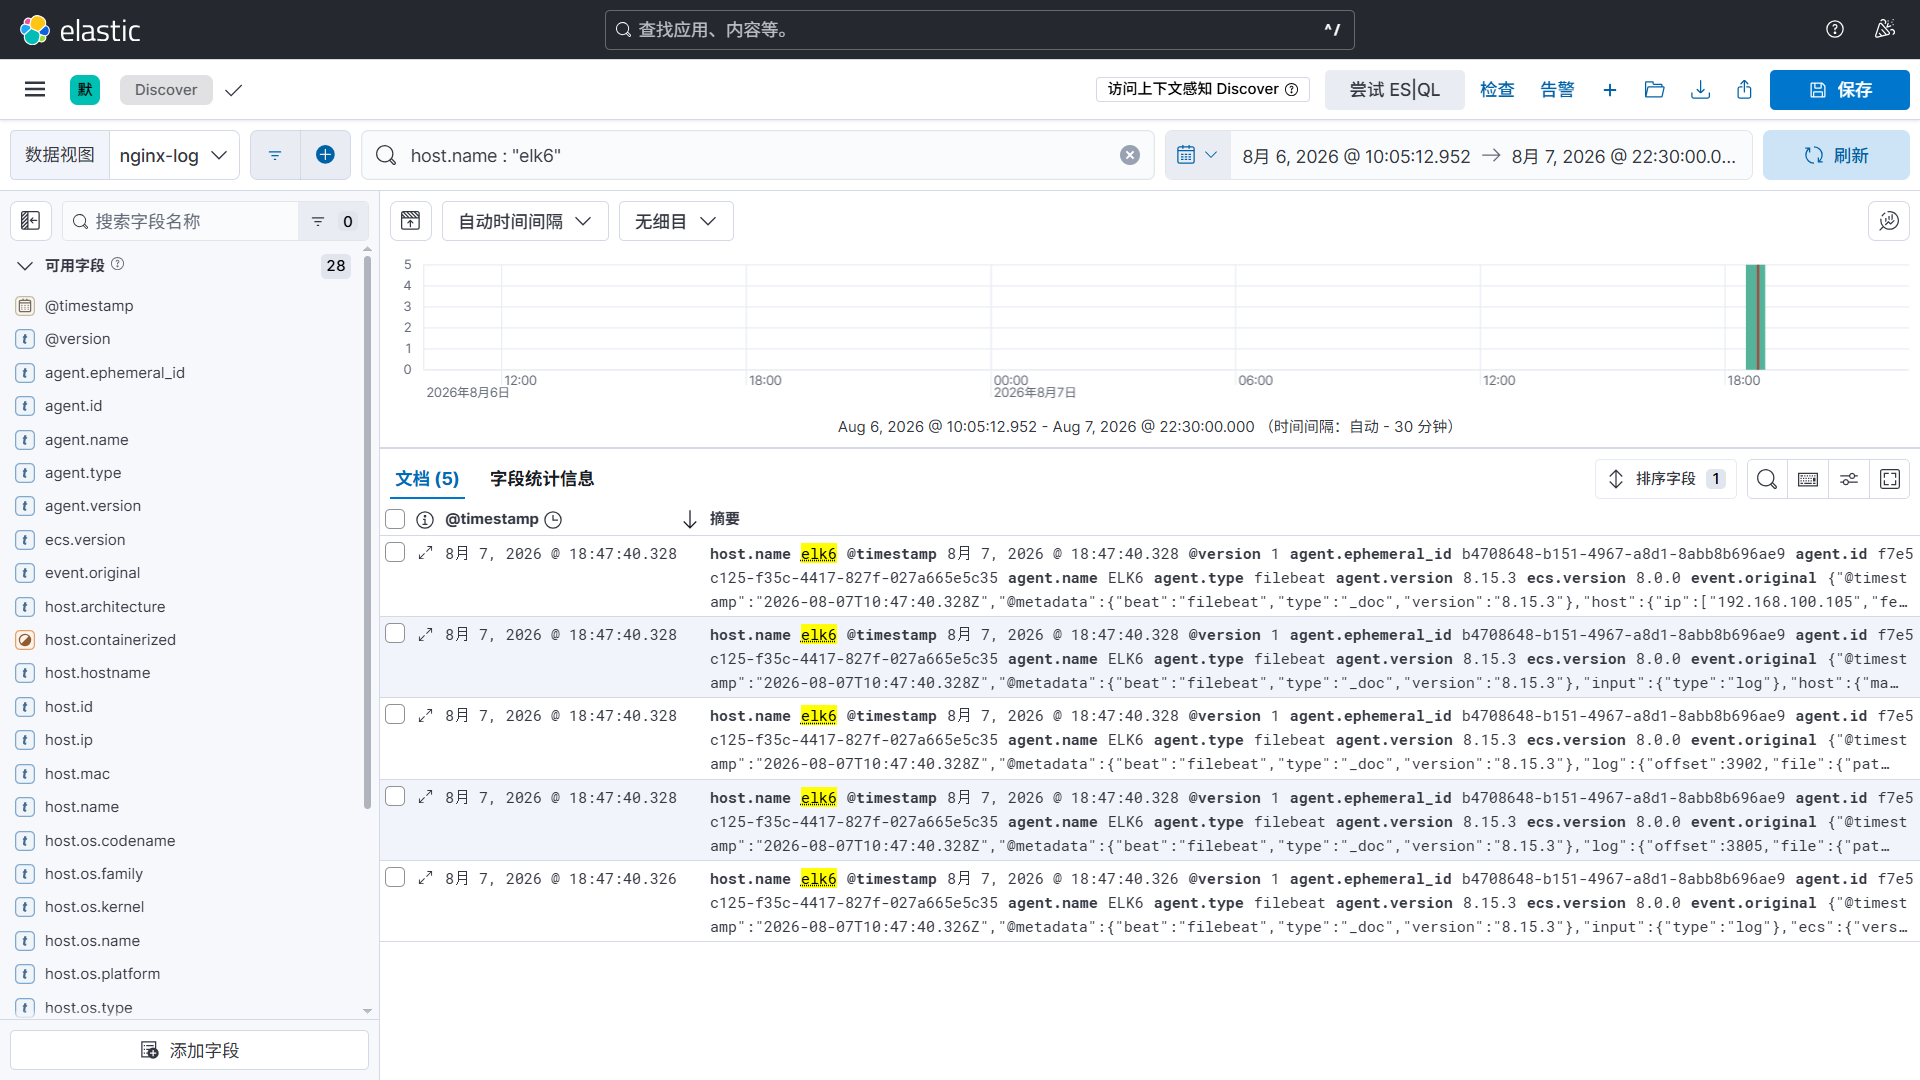
此时我们在kinaba上看到了最新收集的日志,至此我们的ELK+filebeat+kafka部署完成。
七. Grok插件
grok是一个十分强大的logstash filter插件,他可以通过正则解析任意文本,将非结构化的日志数据解析成结构化和方便查询的结构内容。将其定义成我们平时容易理解的一些字段名称。
执行命令
sed -i '/^output {/i\
filter {\
    grok {\
        match => {"message" => "grok_pattern"}\
    }\
}\
' /etc/logstash/conf.d/http_logstash.conf
或者在vi编辑器中将这段复制到input和output之间
这段代码中除了grok_pattern(grok表达式)以外都是logstash的关键字。grok_pattern部分需要使用者填充自己的解析方式。
grok_pattern由零个或多个%{SYNTAX:SEMANTIC}组成
其中SYNTAX是表达式的名字,即文本匹配的模式名称。是由grok提供。例如数字表达式的名字是NUMBER,IP地址的表达式名字是IP。
SEMANTIC表示解析出来的这个字符的名字,即为匹配的文本提供的标识符,由自己定义,例如IP字段的名字可以是client。
对于下面的日志
192.168.1.2 GET /index.html 15824 0.043
可以这样解析
filter {
  grok {
    match => {
      "message" => "%{IP:client} %{WORD:method} %{URIPATHARAM:request} %{NUMBER:bytes} %{NUMBER:duration}"
    }
  }
}
得到这样的结果:
数字表达式的名字是NUMBER,%{NUMBER: duration}可以匹配数值类型。但是grok匹配出的内容都是字符串的类型。可以通过在最后指定为int或者float来强制转换类型。 %{NUMBER:duration:float}
data_type 目前只支持两个值,int和float。
grok提供的SYNTAX可以查看文件grok-patterns。其默认存放的路径是